Fig. 3.
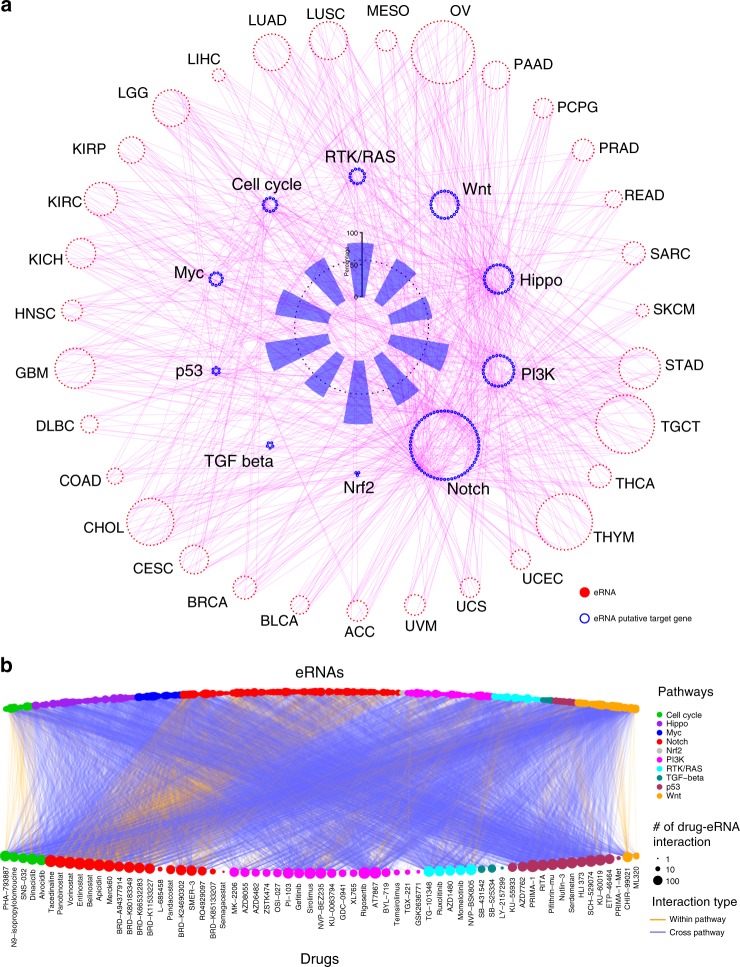
Putatively regulatory network and drug response of eRNAs on signaling pathways. a eRNA and putative target gene in 10 cancer signaling pathways. Red nodes in outer circle denote eRNAs that regulate genes in cancer signaling pathways across cancer types. Blue nodes in middle circle denote putative target gene across cancer signaling pathways. Blue bars in inner circle denote percentage of eRNA putative target genes across each pathway. Magenta links denote correlation between eRNAs and their putative target genes. b Association between eRNAs (top) and drugs (bottom) across different cancer signaling pathways. Orange and blue links, respectively, denote within- and cross-pathway relationships

