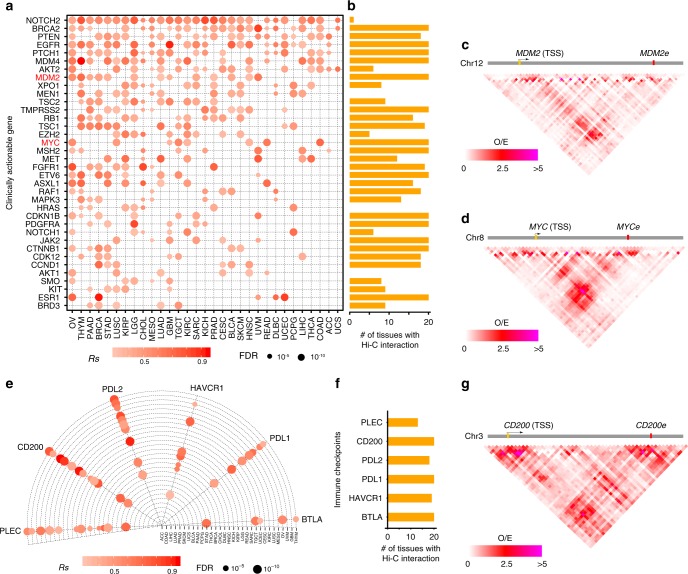
Fig. 4.
Putatively regulatory effects of eRNAs on clinically actionable genes and immune checkpoints. a Correlation between eRNAs and clinically actionable genes in human cancers. Red dots denote significantly correlation. X-axis is cancer type and y-axis is symbol of gene. b Number of tissues with Hi-C interactions between clinically actionable genes and their eRNAs. c Hi-C interaction between MDM2 and MDM2e in blade. d Hi-C interaction between MYC and MYCe in lung. e Correlation between eRNA and cancer immune checkpoints in human cancers. f Number of tissues with remarkable Hi-C interaction between cancer immune checkpoints and their eRNA. g Hi-C interaction between CD200 and CD200e in ovary. Scale bars denote spearman correlation (Rs) in (a) and (e), and Hi-C O/E value in (b), (c), and (g), respectively

