Fig. 5.
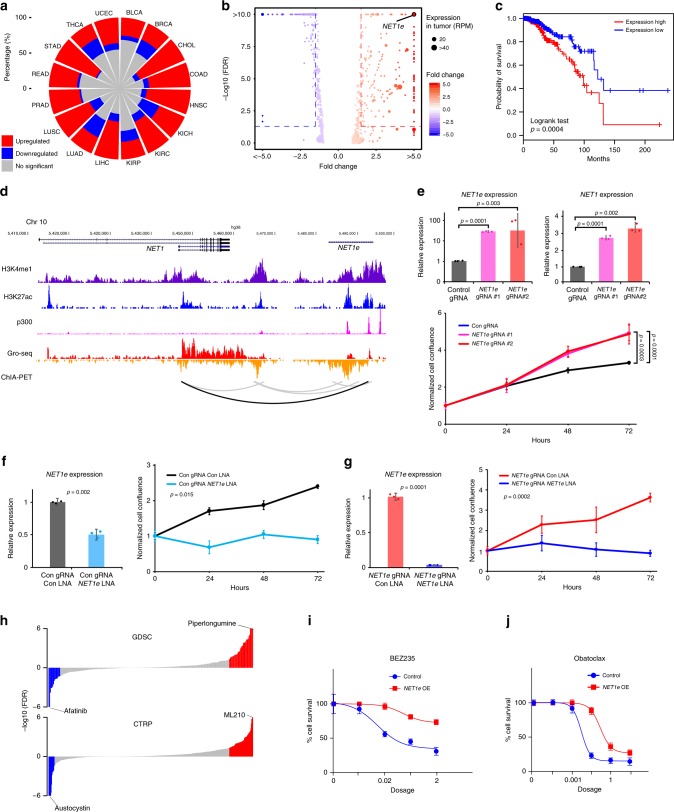
Functional characterization of NET1e in cancer. a Expression alterations of eRNAs in human cancers. Red, blue and gray, respectively, denote percentage of upregulated, downregulated and no significant expression of eRNAs in each cancer type. b Differentially expressed eRNAs in BRCA. Scale bar denotes the fold change between tumor and normal samples. c Survival curves for NET1e in BRCA (top quarter in red vs. bottom quarter in blue). d Epigenetic features and expression of NET1e and NET1 region in MCF7. e Overexpression of NET1e in MCF7 and its functional consequences. Overexpression of NET1e by CRISPR/dCas9-SAM (top left) and NET1 (top right), and cell growth assay with overexpression of NET1e in MCF7 (bottom). f Knockdown NET1e by LNA (left) and cell growth assay (right) in MCF7. g Knockdown NET1e by LNA after activation (left) and cell growth assay (right) in MCF7. h NET1e-associated drugs in GDSC and CTRP database. i Response curve of compound BEZ235 in NET1e overexpressed cells and control. j Response curve of compound Obatoclax in NET1e overexpressed cells and control. Error bars in (e), (f), (g), (i), and (j) indicate mean ± SD

