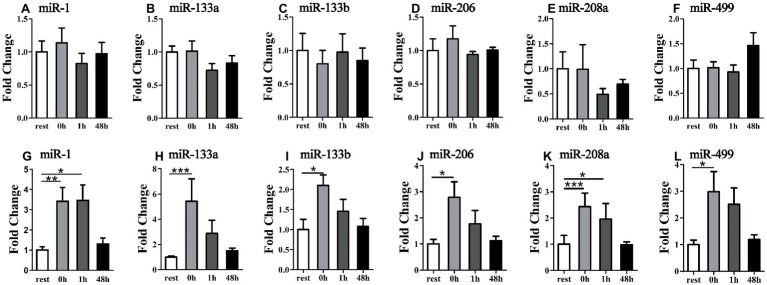
Figure 5.
Time-course changes of exosomal miR-1, miR-133a, miR-133b, miR-206, miR-208a, and miR-499 levels in plasma in response to uphill (A–F) and downhill (G–L) running (n = 12 per time point). Both uphill and downhill running shared the same rest group, and data are expressed as the fold-difference compared to the rest group. The absolute concentration of miRNAs was calculated by referring to calibration curves developed with the corresponding synthetic miRNA oligonucleotides. *denotes p < 0.05; **denotes p < 0.01; ***denotes p < 0.001.

