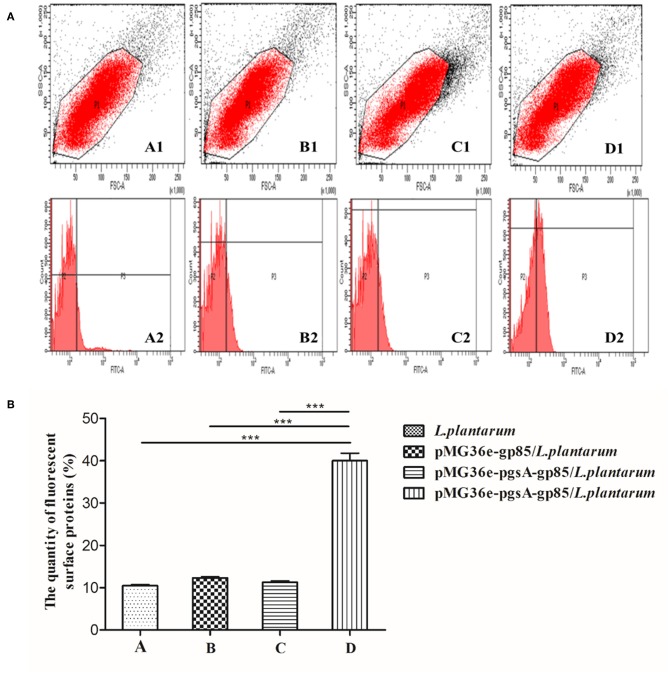
Figure 3.
The results of flow cytometry analysis, monoclonal antibody JE9 as first antibody, FITC-conjugated anti-mouse IgG (Sigma) as secondary antibody to detect the A, B, and D samples and anti-mouse IgG (Sigma) as secondary antibody to detect the C sample. A: L. plantarum; B: pMG36e-gp85/L. plantarum; C, D: pMG36e-pgsA-gp85/L. plantarum. The map of P1 represents the selected flora, P3 stands for the fluorescence intensity of the protein on the surface of L. plantarum (A). Histogram shows the quantity of fluorescence surface proteins in P3 part of flow cytometry analysis (B). P < 0.01 indicates a significant difference between the control and experimental group at the same immunized time. ***P < 0.001.

