
Figure 4.
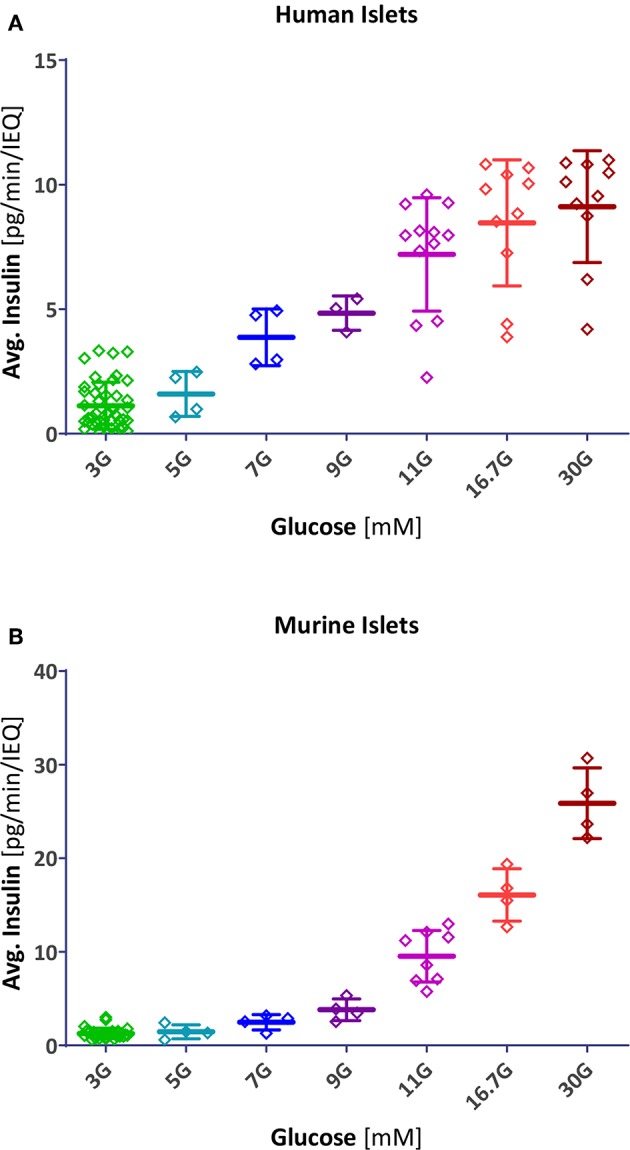
Scatter plot of insulin secretion in response to different glucose concentrations. Data points represent the average insulin secreted by each individual human (A) and mouse (B) islet sample (pg/min/IEQ; first- and second phase combined). Lines indicate group average and SD.