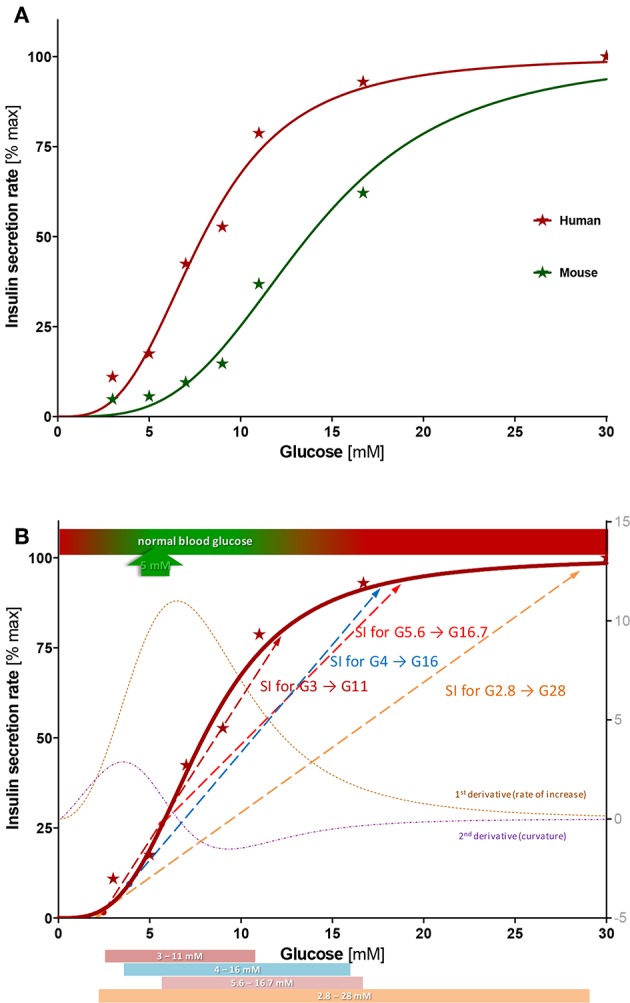
Figure 5.

Concentration-response of insulin secretion. (A) Average insulin secretion rate (first- and second phase) at different glucose steps expressed as percent of maximum value (at G30) and fitted with a sigmoidal dose response function (Hill function, Equation 1). Compared to human islets, mouse islets have a similar Hill slope (n = 3.4 ± 0.4 vs. 3.2 ± 0.4), but a right-shifted response (half-maximal concentration C50 = 13.7 ± 0.6 vs. 7.9 ± 0.4 mM). (B) Best-fit sigmoid function describing percent insulin secretion rate in function of the high glucose challenge for human islets (Equation 1; n = 3.2, C50 = 7.9 mM) overlapped with its first and second derivative (right axis) and some commonly used stimulation indices (SIs). See text for details.
