Figure 3.
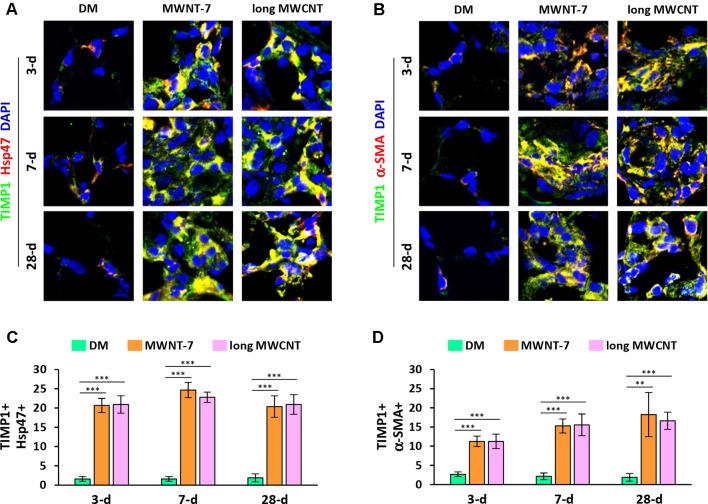
Elevated expression of TIMP1 in fibroblastic cells by MWCNTs in the lung. (A) TIMP1 in fibroblasts examined by double immunofluorescence staining of TIMP1 (green) and Hsp47 (red), with DAPI nuclear staining (blue). The full images with scale bar are shown in Figure S5 . (B) TIMP1 in myofibroblasts examined by double immunofluorescence staining of TIMP1 (green) and α-SMA (red), with DAPI nuclear staining (blue). The full images with scale bar are shown in Figure S6 . In (A) and (B), yellow color is generated from the overlap of green and red. (C) Number of TIMP1+ Hsp47+ cells per unit area (2x104 µm2) is presented as mean ± SD (n = 4). (D) Number of TIMP1+ α-SMA+ cells per unit area (2x104 µm2) is presented as mean ± SD (n = 4).

