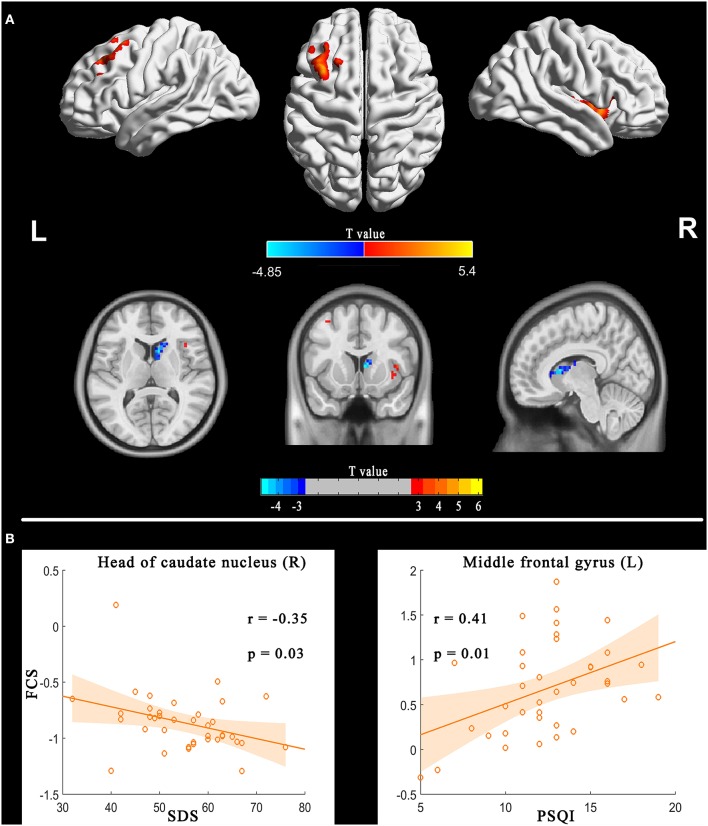
Figure 3.
FCS differences between PI patients and HC (PI-HC, A) and correlation between FCS and sleep scales in the PI group (B). The threshold was P < 0.01 at the voxel level, with Alphasim corrections for multiple comparisons of P < 0.05. The color bar represents the t value. FCS, functional connectivity strength; PI, primary insomnia; HC, healthy controls.

