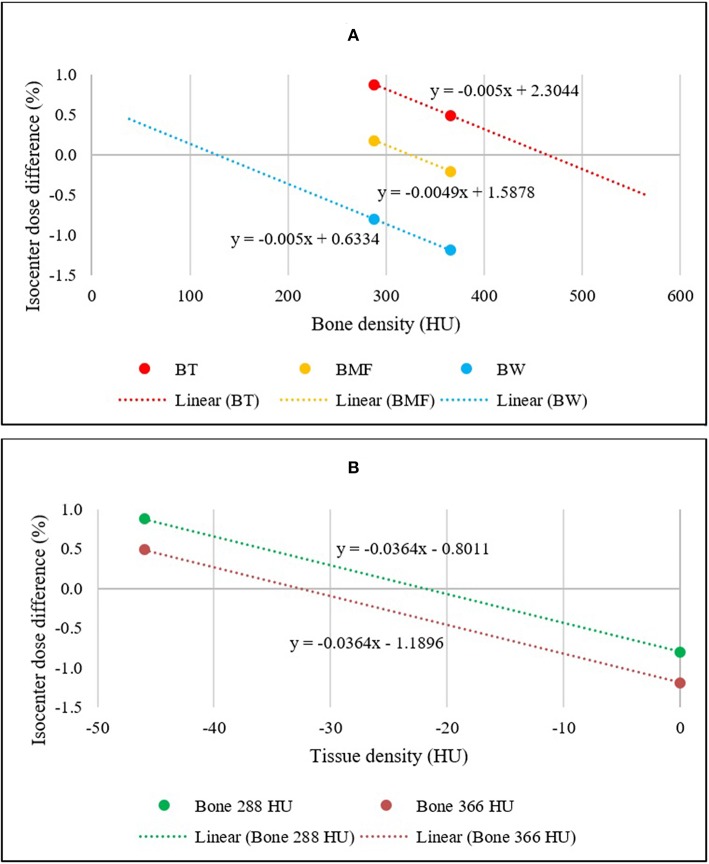
Figure 3.
(A) Linear relationships between the mean isocenter dose differences of BADBW,CT, BADBT,CT, and BADBMF,CT maps to full density CT for two bone density values. The x-intercepts represent the optimal bulk bone density of each method. (B) Linear relationships between the mean isocenter dose differences of BADBW,CT and BADBT,CT maps to full density CT. The x-intercepts represent the optimal bulk Tissue density for BADBT,CT.

