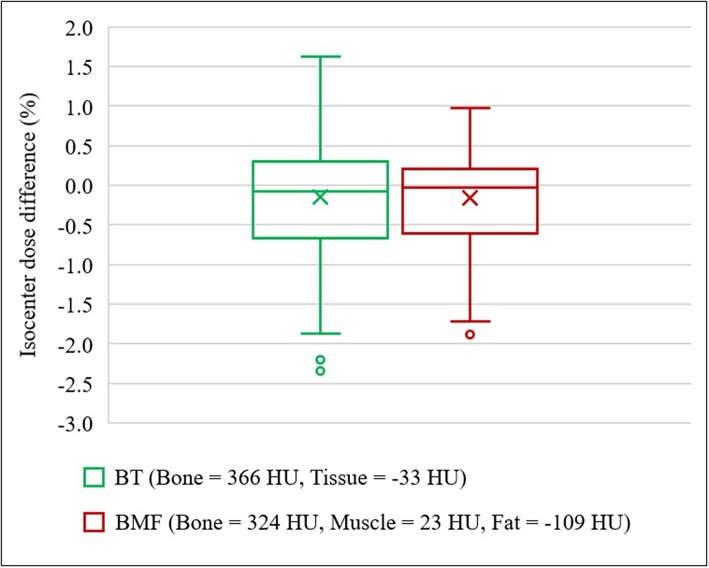
Figure 7.
Isocenter dose differences to CT for optimal density BADMR maps. BADBT,MR (Bone, B = 366 HU; Tissue, T = −33 HU) and BADBMF,MR (Bone, B = 324 HU; Muscle, M = 23 HU; Fat, F = −109 HU). In the presence of outliers, the ends of whiskers indicate the lower (Q1 – 1.5 × IQR) and upper (Q3 + 1.5 × IQR) limits.

