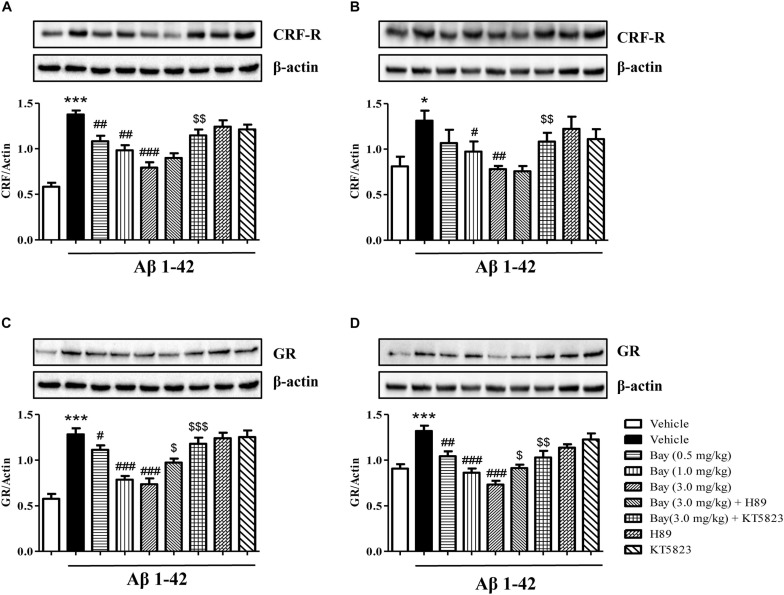
FIGURE 6.
The effects of Bay 60-7550 on Aβ1–42-induced changes in CRF receptor and GR expression in the hippocampus (A,C) and in the cortex (B,D) of mice. Values shown are means ± SEM, n = 10; ∗p < 0.05 and ∗∗∗p < 0.001 vs. vehicle-treated control group. #p < 0.05, ##p < 0.01, and ###p < 0.001 vs. vehicle-treated Aβ group. $p < 0.05, $$p < 0.01, and $$$p < 0.001 vs. Bay (3.0 mg/kg)-treated Aβ group.

