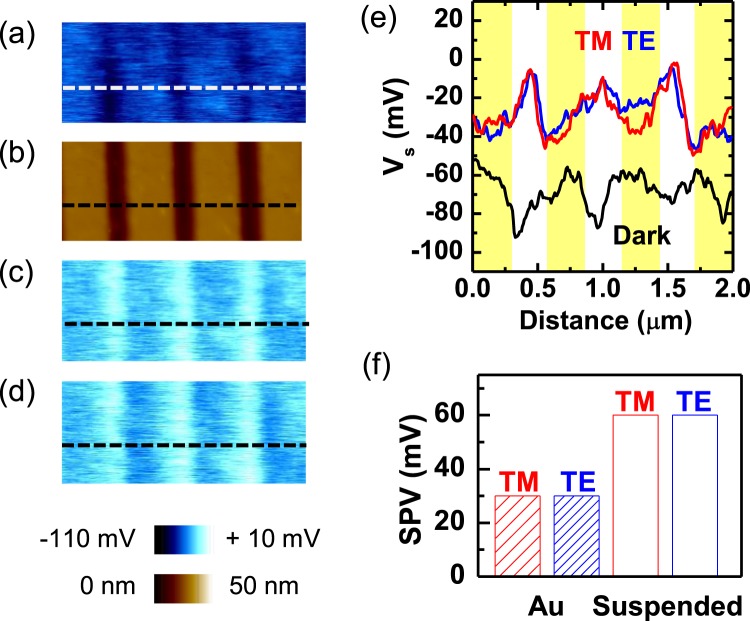
Figure 4.
(a) A VS,D map and (b) an AFM topography image of a MoS2 monolayer on the Au stripe array. VS,L maps of the same region under illumination of (c) TM- and (d) TE-mode linearly polarized light. (e) Measured surface potential data as a function of distance along the dashed lines on the maps. The black, red, and blue lines represent the measured data in the dark, under TM-mode light, and under TE-mode light, respectively. The yellow bars indicate the region on the Au stripe. (f) The measured SPV data at the MoS2 surface on the Au stripe (indicated by ‘Au’) and the suspended MoS2 surface (indicated by ‘Suspended’) under illumination with TM (red) and TE (blue) mode light.

