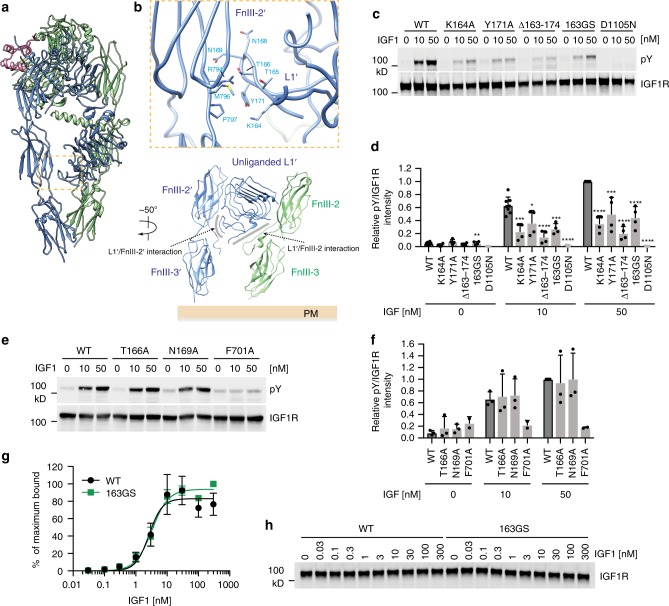
Fig. 5.
L1′/FnIII-2′ interaction in the active-IGF1R dimer. a Overall view of IGF1R active dimer, showing in two different views. b Close-up view of the L1′/FnIII-2′ interaction. The location of this interaction in the IGF1R active dimer is indicated by an orange box in a. c IGF1-induced IGF1R autophosphorylation in 293FT cells expressing WT IGF1R or indicated mutants. The kinase dead mutant (D1105N) was used as a negative control. d Quantification of the western blot data shown in c (Mean ± SD). Each experiment was repeated four times. Significance calculated using two-tailed students t-test; between WT and mutants; *p < 0.05, **p < 0.01, ***p < 0.001, and ****p < 0.0001. e IGF1-induced IGF1R autophosphorylation in 293FT cells expressing WT IGF1R or indicated mutants. The IGF1-binding mutant (F701A) was used as a negative control. f Quantification of the western blot data shown in e (Mean ± SD). Each experiment was repeated three times. g Binding of IGF1 labeled with Alexa Fluor 488 to 293FT cells expressing IGF1R WT or 163GS (Mean ± SD). Each experiment was repeated three times. h Representative western blot images of the amount of IGF1R in g. Source data are provided as a Source Data file

