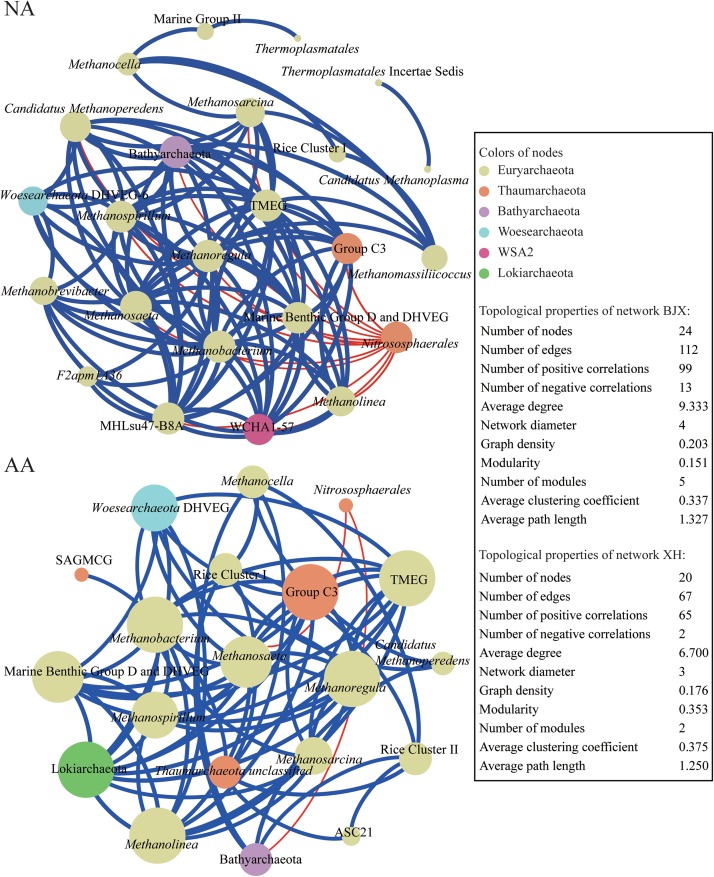
FIGURE 6.
Co-occurring network of archaeal communities in NA and AA based on correlation analysis. The nodes in network are colored by phylum. The connections in the network indicate strong (ρ > 0.6) and significant (P < 0.01) correlations. The size of each node in proportion to the number of connections (i.e., degree); the thickness of each connection between two nodes (i.e., edge) in proportion to the Spearman’s correlation coefficient. A blue edge indicates a positive interaction between two individual nodes, while a red edge indicates a negative interaction.

