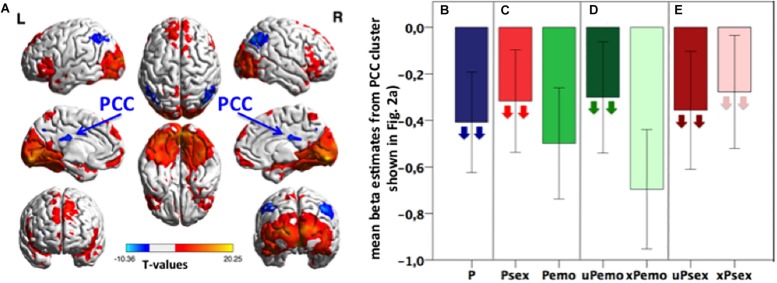
FIGURE 1.
(A) Task activation of the contrast P > fix. Blue color represents deactivation clusters, red color depicts activation clusters. Displayed with BrainNet Viewer (Xia et al., 2013), p < 0.05 FWE, cluster level corrected, with initial threshold p < 0.001, k size > 191, n = 31 subjects. (B–E) Bar plots: Extracted mean beta estimates from the PCC correlation cluster (light blue and yellow shown in Figure 2A) for all picture conditions and subconditions versus fixation, showing differential deactivation. Down-pointing arrows in subconditions indicate negative correlation with the Glu/tCr level in dACC. Higher Glu/tCr in the dACC, more deactivation during certain condition is present. Data is presented in mean ± standard error of the mean (SEM), n = 31. P, all expected and unexpected emotional and sexual pictures; Psex, expected and unexpected sexual pictures; Pemo, expected and unexpected emotional pictures; uPemo, unexpected emotional pictures; xPemo, expected emotional pictures; uPsex, unexpected sexual pictures; xPsex, expected sexual pictures.

