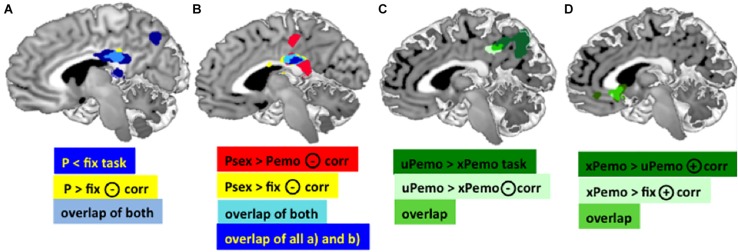
FIGURE 2.
(A) Dark blue: Main effect of task in the PCC for contrast P < fix. Yellow: Negative correlation between the BOLD response for contrast P > fix in the PCC and Glu/tCr in the dACC. Light blue: Overlap of the PCC clusters, MNI [3 –30 25]. (B) Red: BOLD response for contrast Psex > Pemo in the PCC correlates significantly negatively with the dACC Glu/tCr, MNI peak: [2 –28 26]. Yellow: BOLD response for contrast Psex > fix in the PCC correlates significantly negatively with the dACC Glu/tCr, MNI peak: [2 –28 26]. Light blue: overlap of both PCC clusters. Dark blue: overlap of both displayed PCC clusters plus the overlap cluster from (A) (light blue and yellow). (C) Dark green: Task effect in the PCC/Precuneus in contrast xPemo < uPemo, MNI peak [–14 –52 26]; Light green: Negative correlation of the Glu/tCr in dACC and BOLD response in contrast xPemo < uPemo, MNI peak [–10 –38 34]; Bright green: Overlap of both PCC clusters. (D) Overlapping VS clusters. Dark green: Positive correlation of Glu/tCr in dACC and BOLD response for xPemo > uPemo in VS and sgACC MNI peak [2 20 –2]; Light green: Positive correlation of Glu/tCr in dACC and VS BOLD mean estimates for the contrast xPemo > fix, MNI peak: [–2 24 0]; Bright green: overlap of both clusters (note: the light green cluster largely overlaps with the bright green thus is mainly represented in bright green). All pictures are displayed using Mango Software (Lancaster et al.; www.ric.uthscsa.edu/mango), p < 0.05 FWE, cluster level corrected, with initial threshold p < 0.001 n = 27.

