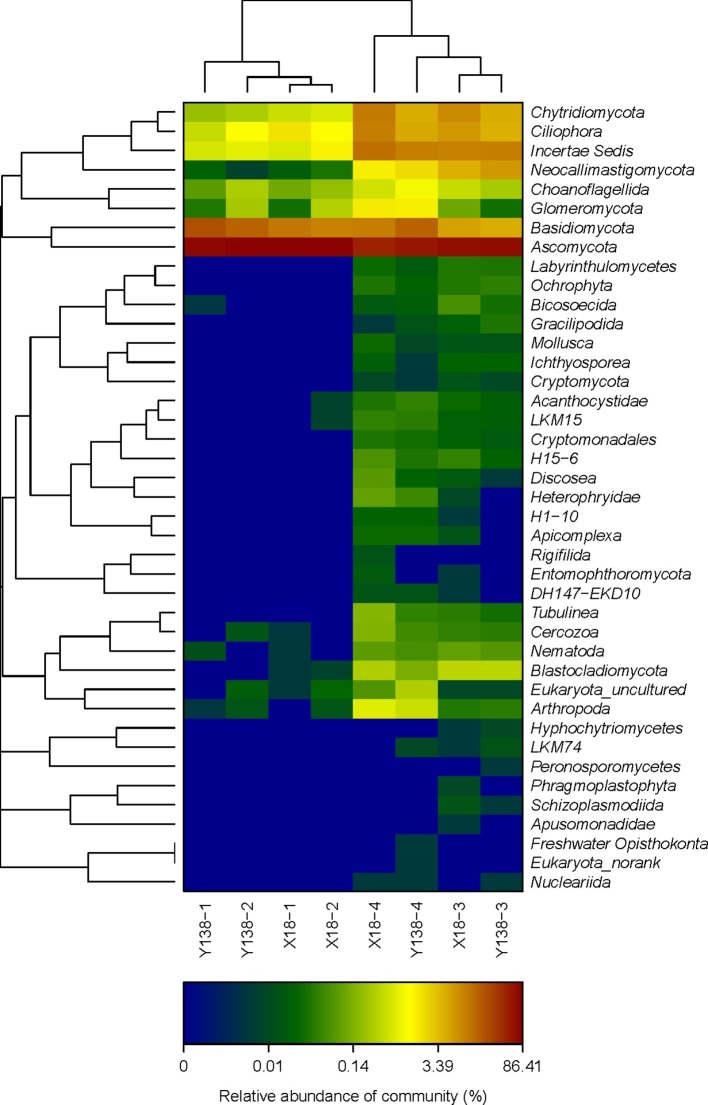
Figure 3.
Microbial community heatmap analysis of the fungal phyla detected across all samples. X18, Xushu 18; Y138, Yizi 138; 1 and 2 represent sampling of early planting and early harvest in 2015, 3 and 4 represent sampling of early planting and early harvest in 2016, respectively. The relative values for fungal phyla are indicated by color intensity with the legend at the bottom of the picture.

