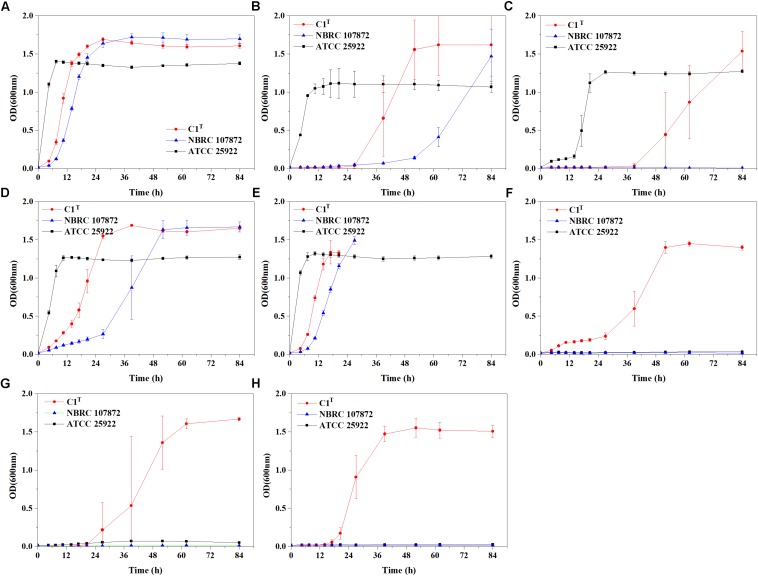
FIGURE 1.
Growth curves of strains C1T, NBRC 107872 and ATCC 25922 in LB liquid medium with heavy metals. (A) Control group, with no heavy metal. (B) 3 mM Cu2+. (C) 0.3 mM Cr(VI). (D) 1.5 mM Ni2+. (E) 3 mM Pb2+. The cultures of strains C1T and NBRC 107872 gradually became brownish black after OD600 exceeded 1.5. (F) 1 mM Cd2+. (G) 0.25 mM Hg2+. (H) 6 mM Zn2+. The values are means of triplicate investigations, and error bars indicate standard deviations. The error bars are large in (B,C,G) due to obvious differences in lag phases among three replicates of strain C1T.

