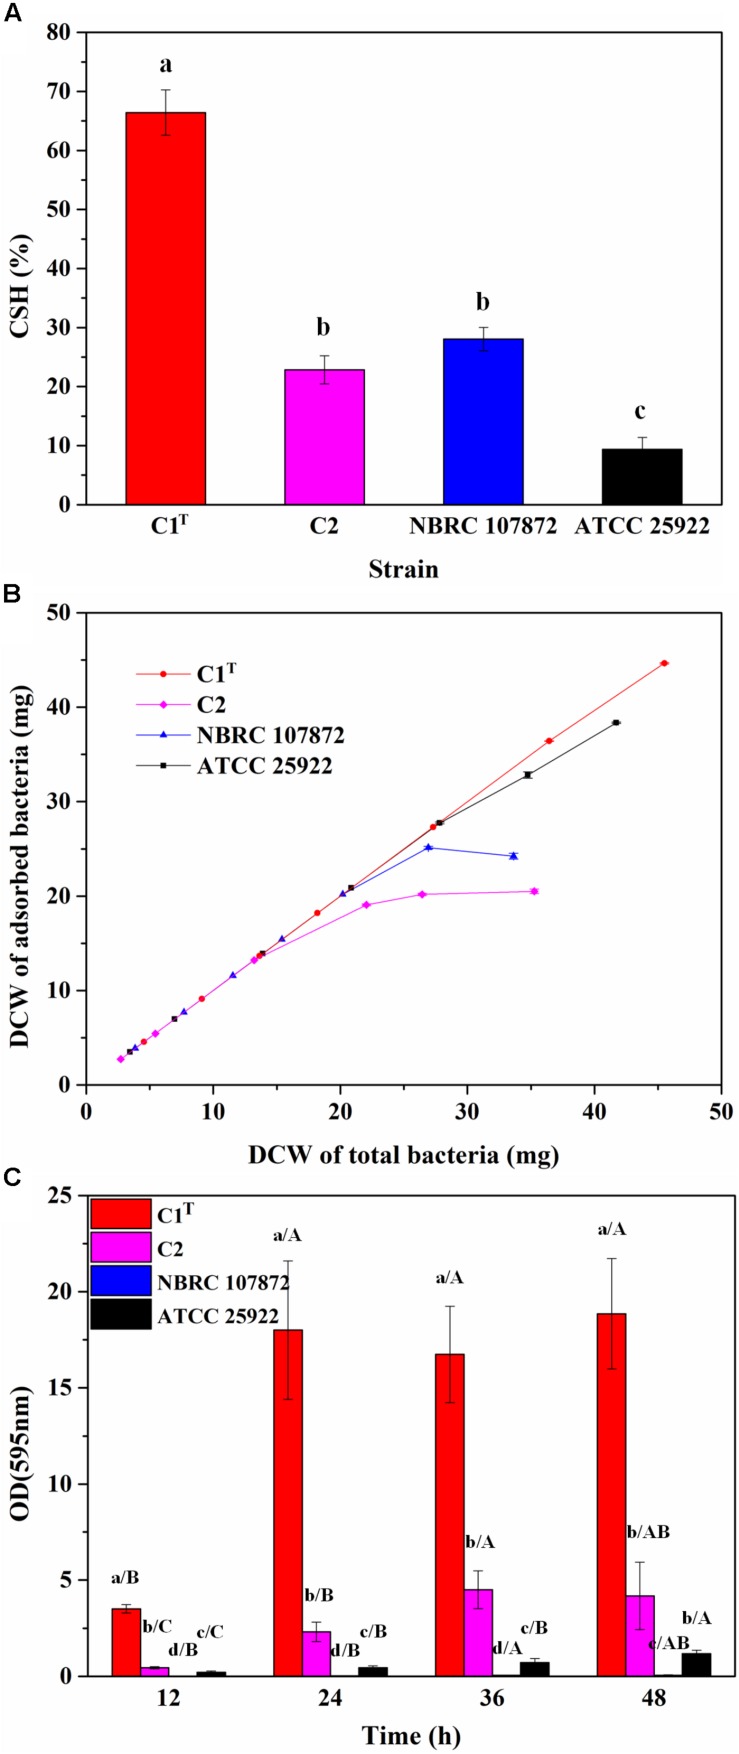
FIGURE 2.
The colonization ability of strains C1T, C2, NBRC 107872 and ATCC 25922. (A) Cell surface hydrophobicity (CSH) measured by MATH protocol. The values are means of triplicate investigations, and error bars indicate standard deviations. Significant differences were tested by one-way ANOVA with Bonferroni test (n = 3, α = 0.05). The a, b and c represent the differences among these strains. (B) The adhesion capacity to kaolinite. Experiments were conducted with a fixed amount of kaolinite (4 g/L) and varying amounts of bacteria in 30 mL of 1 mM KNO3. The values are means of triplicate investigations, and error bars indicate standard deviations. DCW, (dry cell weight. (C) The biofilm-forming ability quantified by crystal violet staining. The values are means of sextuplicate investigations, and error bars indicate standard deviations. Significant differences were tested by one-way ANOVA with Tamhane’s T2 test (n = 6, α = 0.05). Lowercase letters represent the differences among these strains at the same incubation time, while capital letters represent the differences among different incubation time of a strain.)

