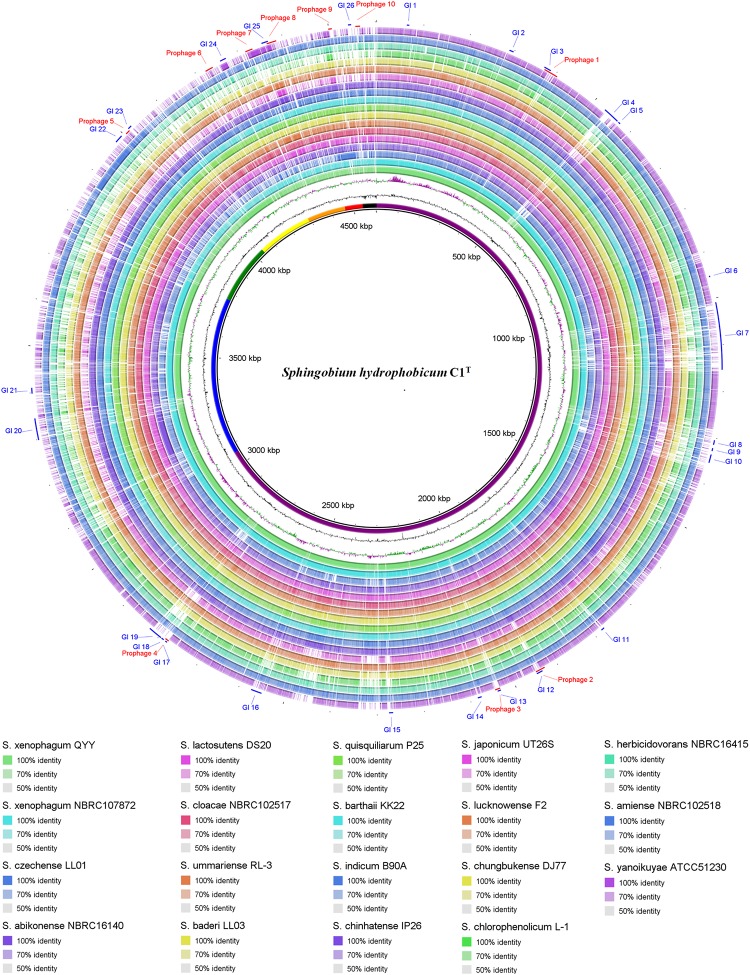
FIGURE 3.
Circular representation of the C1T genome and comparison results with other Sphingobium genomes. From inner to outer ring: (1) Seven replicons of strain C1T, (2) GC content, (3) GC skew, (4–21) Genome comparison (Blastn) results between strain C1T and other Sphingobium strains listed at the bottom, (22) Prophages predicted by PHASTER, (23) GIs predicted by IslandViewer4.

