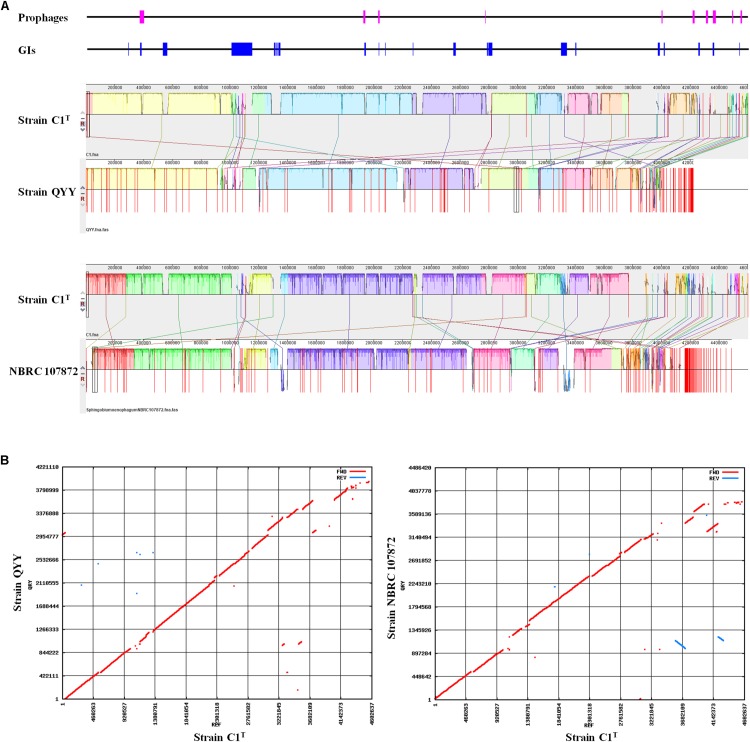
FIGURE 4.
Genome alignment of strains C1T, QYY and NBRC 107872. (A) Genome alignment by Mauve. Each of colored blocks represents a presumably homologous region. Blocks above/below the center line respectively indicate aligned regions in the forward/reverse (reverse complement) orientation. The height of the similarity profile inside each block corresponds to the level of sequence conservation. The positions of prophages and GIs in the C1T genome are shown correspondingly at the top. (B) Genome alignment by Mummer. Red/blue dots correspond to pairs of homologous sequences in the forward/reverse (reverse complement) orientation.

