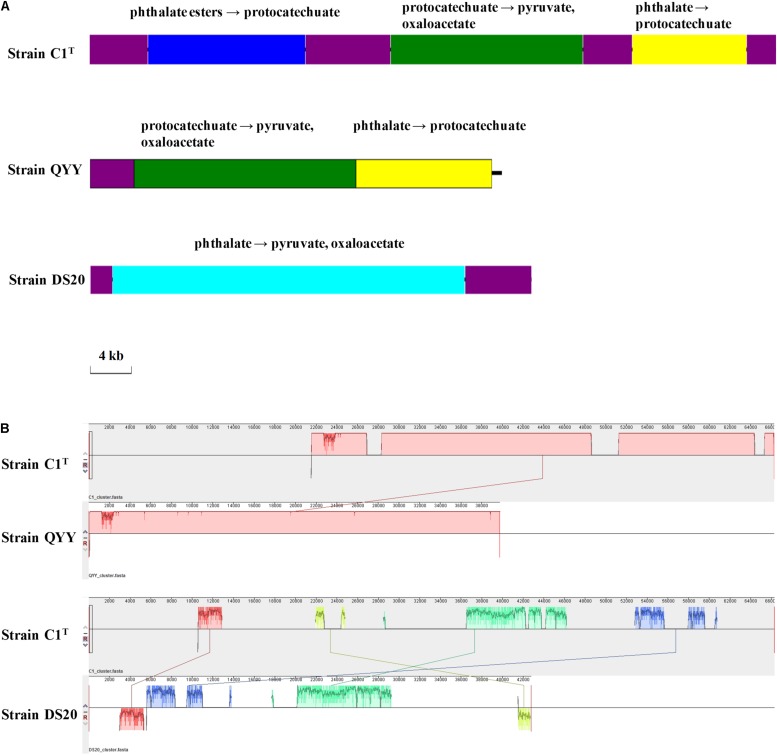
FIGURE 7.
The PAEs degradation gene clusters of strains C1T, QYY and DS20. (A) Organizations of these gene clusters. The purple blocks represent ISs. Other blocks contain genes responsible for corresponding metabolic processes. (B) Homologous regions between these gene clusters detected by Mauve. The image scales of (A,B) are the same.

