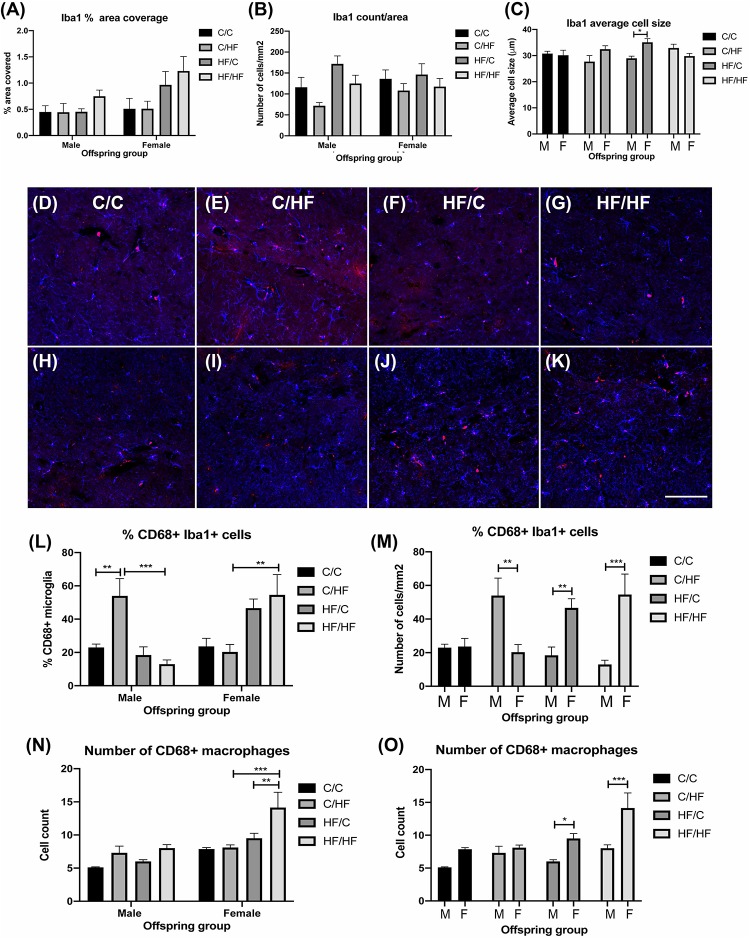
FIGURE 7.
Evaluation of microglia and macrophage expression in the hippocampus of aged male and female offspring. (A–C) Quantification of the percent of hippocampal coverage (A), cell count (B) and average size (C) of Iba1-positive microglia in 16-month old C/C, C/HF, HF/C and HF/HF mice. (D–K) Photomicrographs of hippocampal tissue sections stained for Iba1 (blue) and CD68 (red) in 16-month old male (D–G) and female (H–K) C/C (D,H), C/HF (E,I), HF/C (F,J) and HF/HF (G,K) mice. (L,M) Quantification of the percentage of Iba1-positive microglia that are also positive for CD68 within each diet group (L) and between male and female offspring (M). (N,O) Quantification of the number of CD68-positive macrophages within each diet group (N) and between male and female offspring (O). Data represent mean ± SEM. ∗p < 0.05, ∗∗p < 0.01, ∗∗∗p < 0.001, two-way ANOVA with Holm–Sidak post hoc test. Scale bar = 100 μm.

