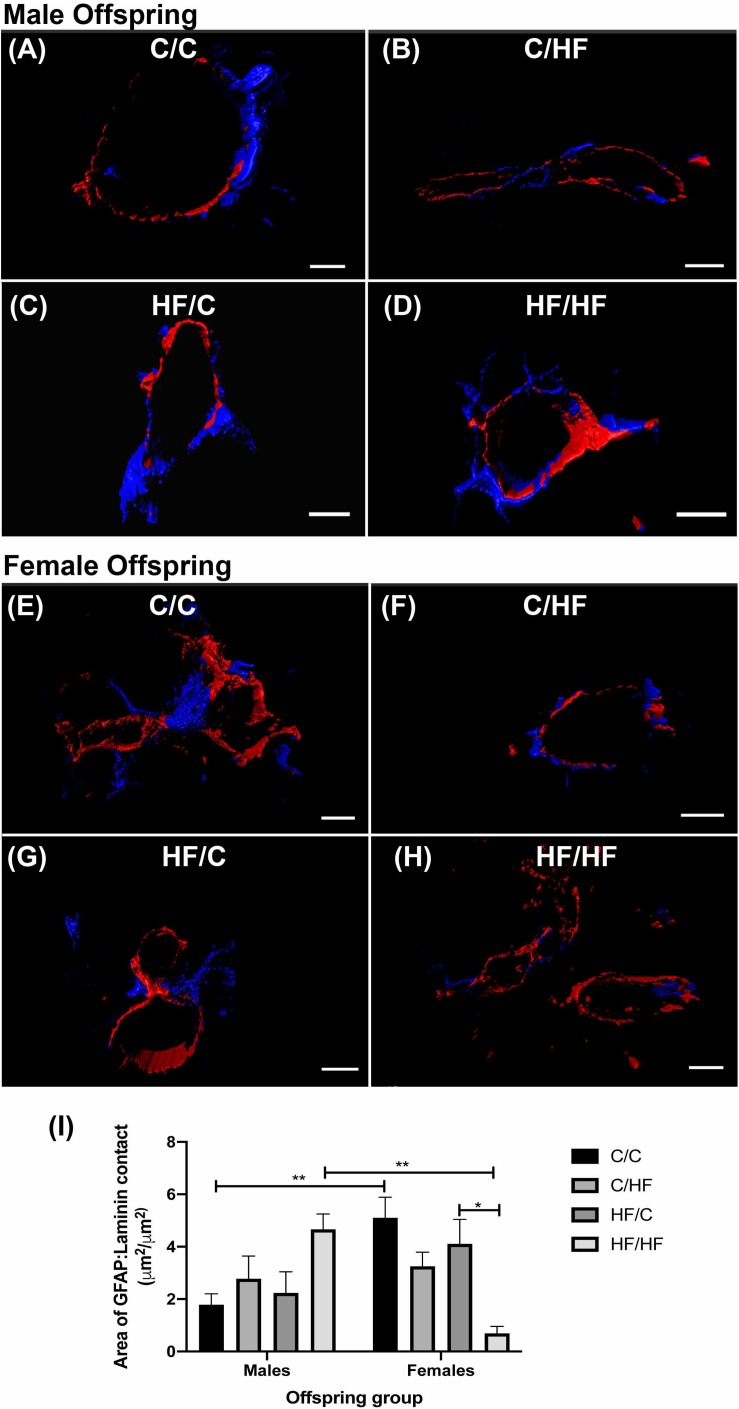
FIGURE 8.
Astrocyte endfoot coverage of hippocampal arteries in male and female offspring. (A–H) Representative images of the 3D reconstruction of GFAP (blue) and laminin (red) staining of hippocampal arteries in male (A–D) and female (E–H) C/C (A,E), C/HF (B,F), HF/C (C,G) and HF/HF (D,H) mice. (I) Quantification of the surface area of contact between GFAP-positive astrocytes and laminin in arteries of male and female offspring. Data represent mean ± SEM. ∗p < 0.05, ∗∗p < 0.01, two-way ANOVA with Holm–Sidak post hoc test. Scale bars: (A) = 7 μm; (B,D–F,H) = 10 μm; (C) = 5 μm; (G) = 8 μm.

