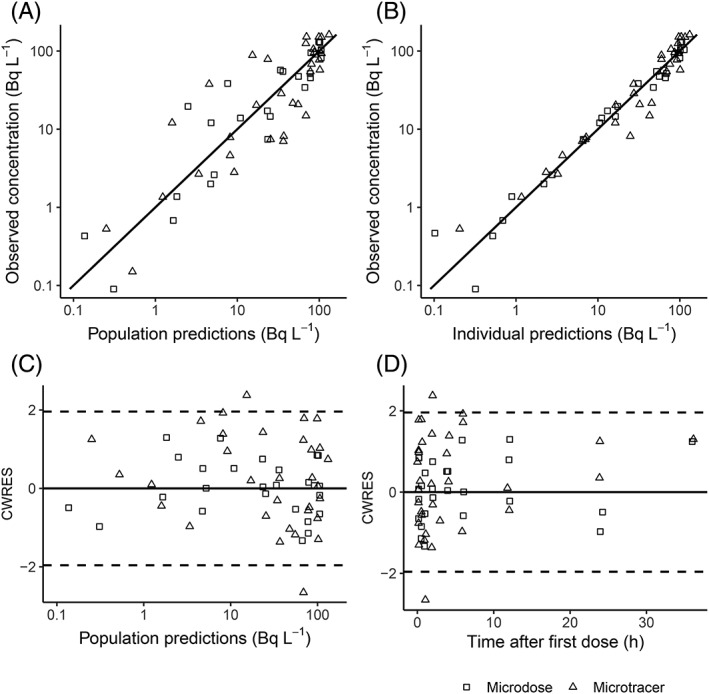
Figure 4.

Diagnostic plots for [14C]midazolam pharmacokinetic model, using different symbols for the different treatments. (A) Observed vs population predicted [14C]midazolam concentrations. (B) Observed vs individually predicted [14C]midazolam concentrations. (C) Weighted residuals vs population predicted [14C]midazolam concentration. (D) Weighted residuals vs time. Solid lines represent the line of unity in A and B, and a value of 0 in C and D. dotted line represent ±1.96 standard deviation, representing the interval in which 95% of the conditional weighted residual (CWRES) values are expected
