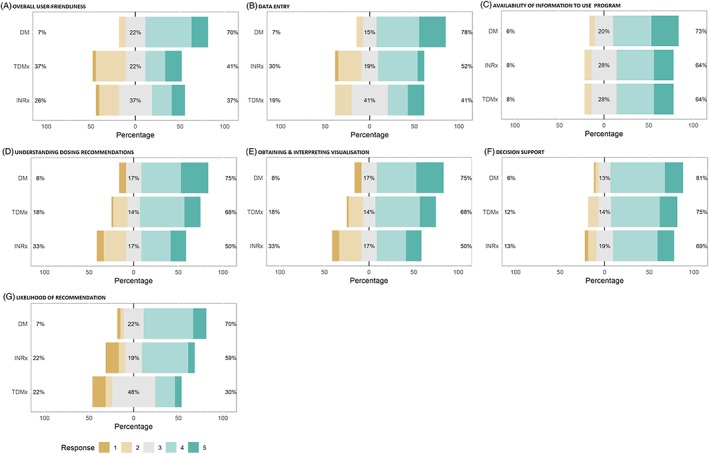
Figure 1.

Bar plots displaying the survey response as per Likert score for each category and BF program together with the percent of participants scoring 4 and 5 labelled as liked, 3 labelled as neutral, and 1 and 2 labelled as disliked, displaying their frequencies for each program. Results are shown for the 7 themes for the 5‐point Likert scale
