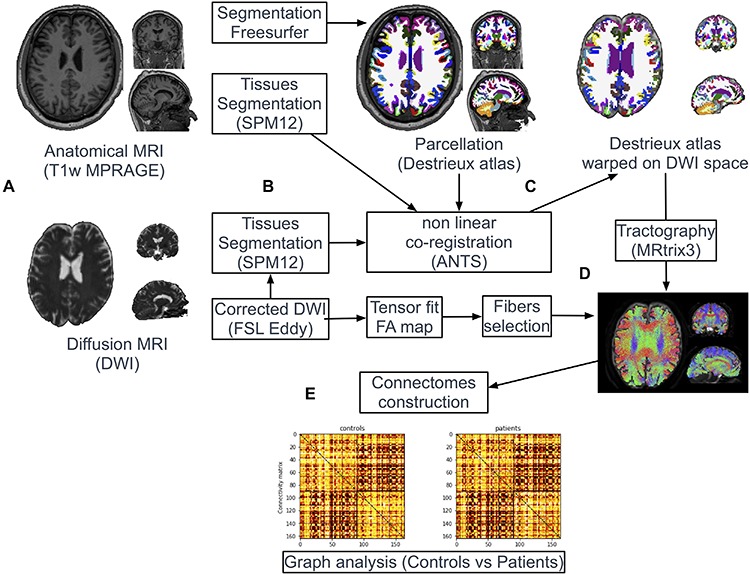
FIGURE 1.

Pipeline of image processing and graph analysis. T1w and diffusion MRI sequences were acquired from all patients and controls (A). Following automatic parcellation of the structural images into cortical and subcortical regions (B), the two set of images were non-linearly co-registered (C). White matter tracts were reconstructed based on diffusion data using the probabilistic algorithm of MRtrix (D). Individual brain network maps were generated using nodes and white matter connections resulting in a FA-weighted connectivity matrix for each subject. Graph analyses were performed on the FA-based connectivity matrix (E).
