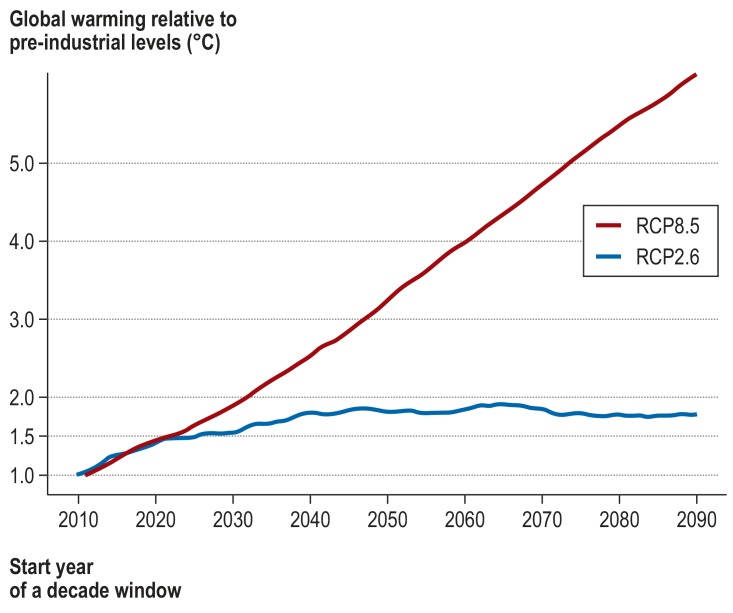
Figure 2.
Time-series of the moving average of change in annual global mean near-surface air temperature over a period of 10 years relative to pre-industrial levels in different climate scenarios (Representative Concentration Pathway, RCP; see Box). RCP8.5 assumes no further measures to reduce emissions; RCP2.6 aims at limiting global warming to less than 2 °C. The x-axis shows the start year of a 10-year moving average.

