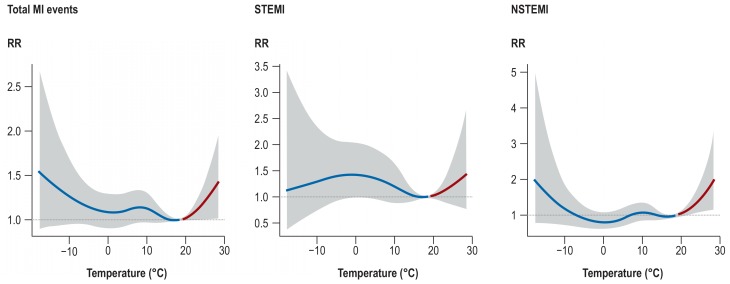
eFigure.
Cumulative exposure–response functions between air temperature and myocardial infarction (with 95% confidence intervals) in Augsburg, Germany in the period 2001 to 2014. The exposure–response functions were obtained from Chen et al. (2019) (15). The red lines represent the effect of heat (temperature above 18.4 °C), while the blue lines show the effect of cold (temperature below 18.4 °C).

