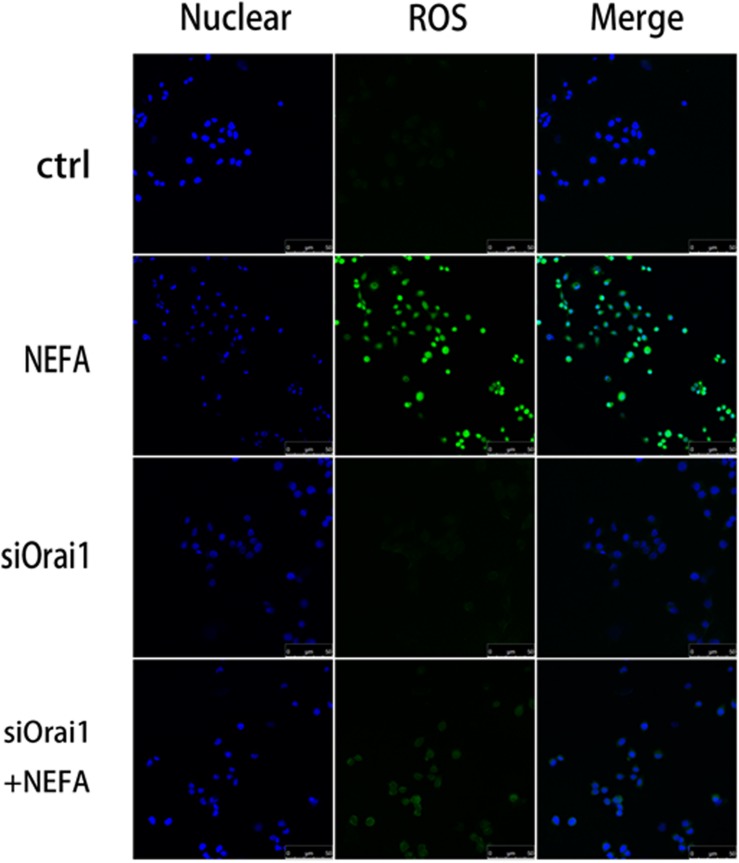
FIGURE 10.
Effect of high-concentration NEFAs and siOrai1 on ROS in BRL-3A cells. Original immunofluorescence images demonstrating nuclear staining (blue; left images), ROS (green; middle images), and an overlaying of both nuclear staining and ROS (right images) in BRL-3A cells incubated without (upper images) or with (second images) NEFAs (1.2 mM, 3 h), siOrai1 (third images), or siOrai1 + NEFAs (lower images). Scale bar: 25 μm.

