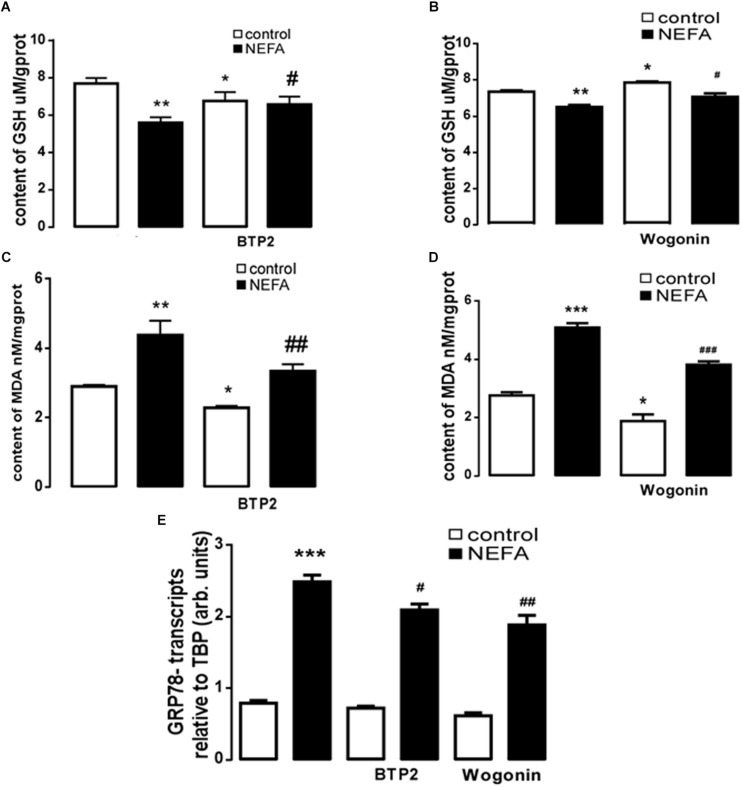
FIGURE 5.
Effect of NEFAs on content of MDA and GSH, transcription of GRP78 in BRL-3A cells with or without the presence of 2-APB and Wogonin. (A) Arithmetic means ± SEM (n = 15) of the content of GSH in BRL-3A cells incubated without (white bar) or with (black bar) NEFAs (1.2 mM, 3 h) in the absence (left bars) or presence (right bars) of Orai inhibitor BTP2 (200 nM). (B) Arithmetic means ± SEM (n = 15) of the content of GSH in BRL-3A cells incubated without (white bar) or with (black bar) NEFAs (1.2 mM, 3 h) in the absence (left bars) or presence (right bars) of NFκB inhibitor wogonin (100 μM). (C) Arithmetic means ± SEM (n = 15) of the content of MDA in BRL-3A cells incubated without (white bar) or with (black bar) NEFAs (1.2 mM, 3 h) in the absence (left bars) or presence (right bars) of Orai inhibitor BTP2 (200 nM). (D) Arithmetic means ± SEM (n = 15) of the content of MDA in BRL-3A cells incubated without (white bar) or with (black bar) NEFAs (1.2 mM, 3 h) in the absence (left bars) or presence (right bars) of NFκB inhibitor wogonin (100 μM). (E) Arithmetic means ± SEM (n = 11) of Grp78 mRNA abundance (relative to Tbp mRNA) in BRL-3A cells incubated without (white bar) or with (black bar) NEFAs (1.2 mM, 12 h) in the absence (left bars) or presence (right bars) of Orai inhibitor BTP2 (200 nM) or of NFκB inhibitor wogonin (100 μM). ∗p < 0.05, ∗∗p < 0.01, ∗∗∗p < 0.001 indicate significant difference from control; #p < 0.05, ##p < 0.01, ###p < 0.001 indicate significant difference from NEFAs alone (one-way ANOVA).

