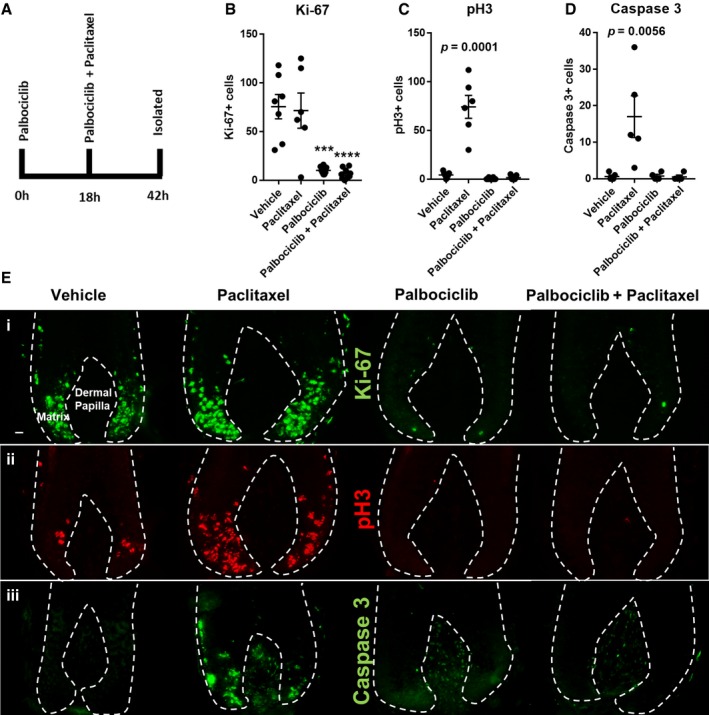
Figure 5. Palbociclib blocks paclitaxel‐induced mitotic defects and apoptosis in the human hair follicle matrix.

-
ASchematic of experimental design. Hair follicles (HFs) were pre‐incubated with the CDK4/6 inhibitor palbociclib for 18 h, followed by a further incubation period with and without paclitaxel (or paclitaxel alone) for an additional 24 h.
-
BPalbociclib‐only‐ and palbociclib plus paclitaxel dual‐treated HFs show marked reductions in Ki‐67 expression in the hair matrix beyond that seen with just 24‐h treatment (see Appendix Fig S2B). Data also confirm that Ki‐67 expression is unaffected by paclitaxel treatment (see also Fig 1A). Analysis performed using N of 6–9 HFs per condition from three patients. Ordinary one‐way ANOVA with multiple comparisons performed. Adjusted P values = 0.0001[***] and 0.0001 [****], respectively.
-
CData confirming that paclitaxel treatment significantly increases (adjusted P value = 0.0001) the number of pH3+ cells in the hair matrix (see also Fig 1C). This effect was not observed when paclitaxel‐treated hair follicles were pre‐ and co‐incubated with palbociclib. Analysis performed using N of 6–9 HFs per condition from three patients. Ordinary one‐way ANOVA with multiple comparisons performed.
-
DCleaved caspase‐3 analysis in hair follicles from a patient donor that showed apoptotic sensitivity to paclitaxel treatment (see Fig 3D and E and results, main text) (adjusted P value = 0.0056). Paclitaxel‐treated hair follicles pre‐ and co‐incubated with palbociclib do not show enhanced cleaved caspase‐3 expression, contrasting with paclitaxel‐only treatment. Ordinary one‐way ANOVA with multiple comparisons performed using N of 4–5 HFs per condition.
-
EImmunofluorescence data representing how palbociclib and/or paclitaxel affect (i) Ki‐67 expression, (ii) pH3 immunoreactivity and (iii) cleaved caspase‐3 expression. 20‐μm scale.
