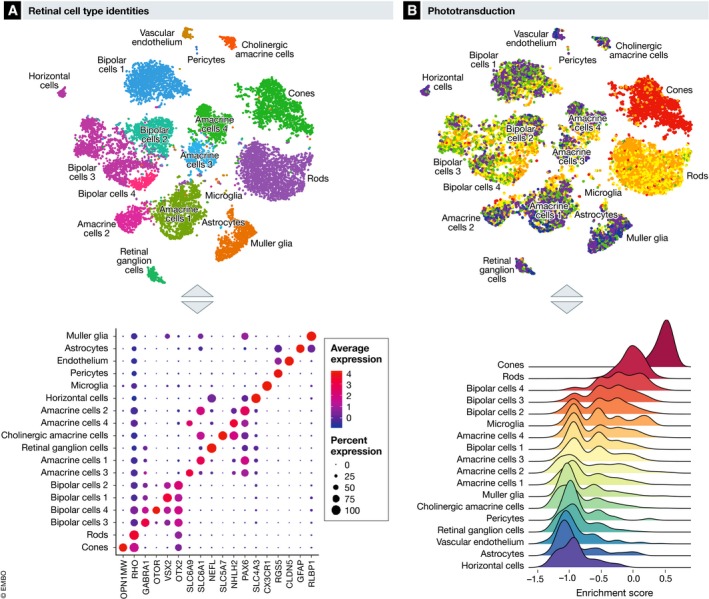
Figure 3. Cell‐specific transcriptional regulation of retinal functions.

Adapted from Macosko et al, Cell 2015. (A) Retinal cell types can be identified using single‐cell RNAseq based on cell‐specific expression of genes markers. OPN1MW, Opsin 1, medium wave sensitive; RHO, rhodopsin; GABRA1, gamma‐aminobutyric acid type A receptor alpha1 subunit; OTOR, otoraplin; VSX2, visual system homeobox 2; OTX2, orthodenticle homeobox 2; SLC6A9, solute carrier family 6 member 9; SLC6A1, solute carrier family 6 member 1; NEFL, neurofilament light; SLC5A7, solute carrier family 5 member 7; NHLH2, nescient helix‐loop‐helix 2; PAX6, paired box 6; SLC4A3, solute carrier family 4 member 3; CX3CR1, C‐X3‐C motif chemokine receptor 1; RGS5, regulator Of G protein signaling 5; CLDN5, claudin 5; GFAP, glial fibrillary acidic protein; RLBP1, retinaldehyde binding protein 1. (B) Transcriptomic enrichment for specific pathway such as the phototransduction pathways can be scored using gene set variation analysis based on highly variable genes between retinal cell types.
