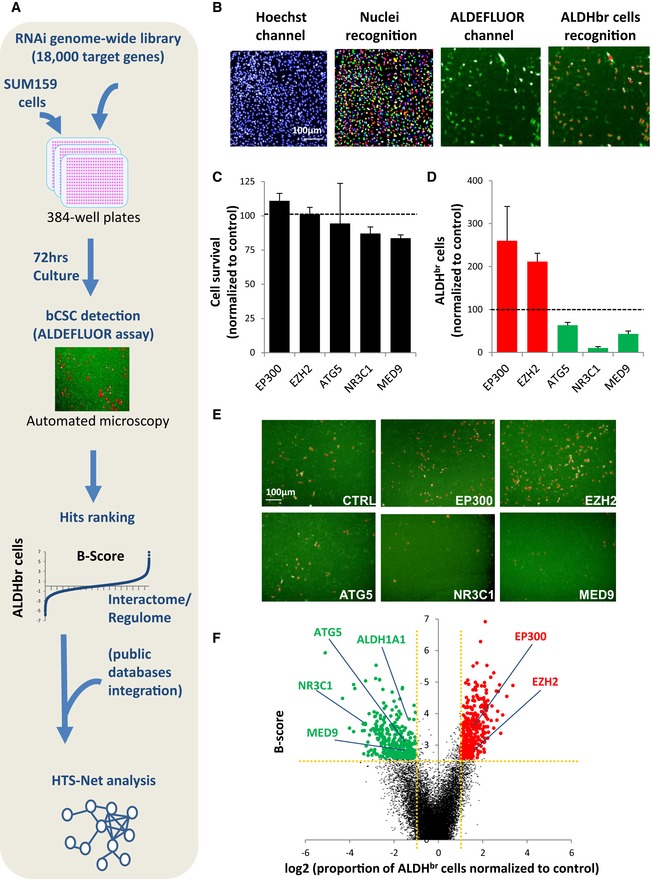
Figure 1. A genome‐wide RNAi screen for the identification of bCSC‐fate regulator.

-
ASchematic representation of RNAi screening strategy.
-
BDetection of ALDHbr cells by high‐content screening. The algorithm first detects nuclear region of interest (ROI) in the Hoechst channel (rainbow areas). Then, it computes the averaged ALDH signal in the ROI to identify ALDHbr cells (red nuclear ROIs) and calculate their proportion.
-
C, DExample of candidate genes whose silencing modified the ALDHbr cell proportion without inducing a massive cell death (cell viability > 20%, B‐score >|2.58|). Data represent mean ± SD (n = 3).
-
ERepresentative images of the high‐content screening captures. ALDEFLUOR cellular staining is represented in green. ALDHbr cells are labeled in red.
-
FVolcano plot of the hits. Scatter points represent genes, the x‐axis is the log2 fold change of the proportion of ALDHbr cells compared to the control, and the y‐axis is the B‐score. Genes targeted by a siRNA inducing a significant reduction (green dots; B‐score > 2.58, log2 FC < 1) or increase (red dots; B‐score > 2.58, log2 FC > 1) of the ALDHbr cell proportion are highlighted.
Source data are available online for this figure.
