-
A
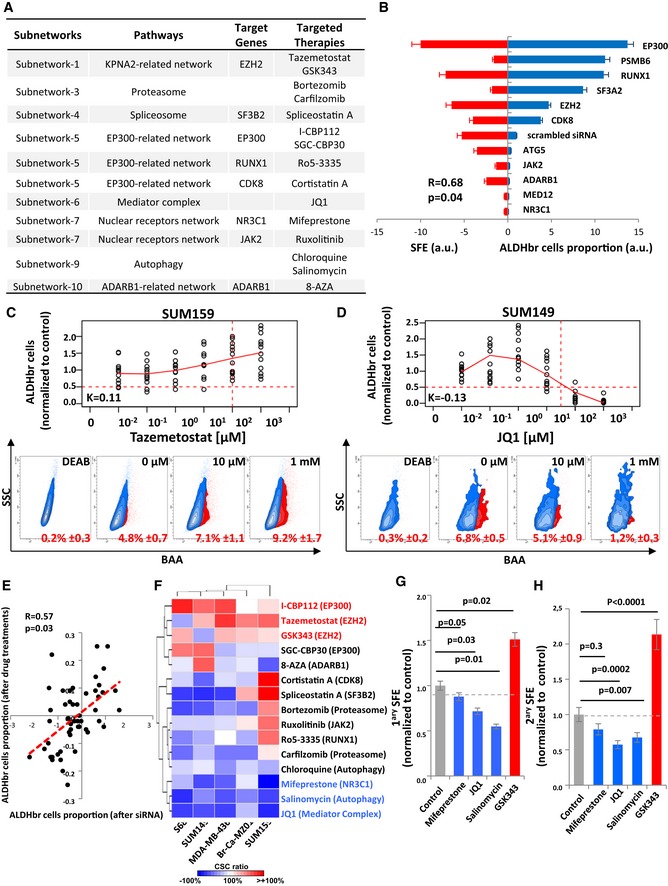
Table summarizing the different target genes/targeted therapies identified for each subnetworks.
-
B
Comparison of bCSC variation after gene knockdown by ALDEFLUOR phenotyping (right) and tumor SFE (left) using the 11 siRNA pools (3 siRNAs/pool) against the selected target genes and one scrambled siRNA pool used as control. Results for each siRNA pool (from top to bottom) are represented as opposite bars (n = 3). Correlations are measured using Spearman rank correlation (R).
-
C, D
Examples of dose‐dependent ALDHbr cells variation in response to drug treatments. ALDHbr cell proportion in response to tazemetostat in SUM159 (n = 10) (C) and JQ1 in SUM149 (n = 10) (D). The horizontal red dashed line corresponds to a reduction of 50% of the ALDHbr cell proportion in the treated conditions compared to the control, and the vertical red dashed line corresponds to the target dose predicted by the K‐score. On the bottom panel, corresponding flow charts for the ALDEFLUOR staining. DEAB is an ALDH inhibitor used as negative control.
-
E
Pearson correlation analysis of the variation of the ALDHbr cells proportion upon drug treatment and gene silencing.
-
F
Heat map for the variation of the ALDHbr cells proportion under drug treatment, in five different cell lines. Red and blue indicate the K‐score in treated conditions, respectively, above and below the K‐score in the untreated condition.
-
G, H
Primary (n = 4) (G) and secondary (n = 4) (H) tumorsphere‐forming efficiency (SFE) of SUM159 cells under treated and untreated conditions. Gray dashed line corresponds to the level of SFE in the untreated conditions. Statistical test used is pairwise chi‐square test. Data represent mean ± SD.

