-
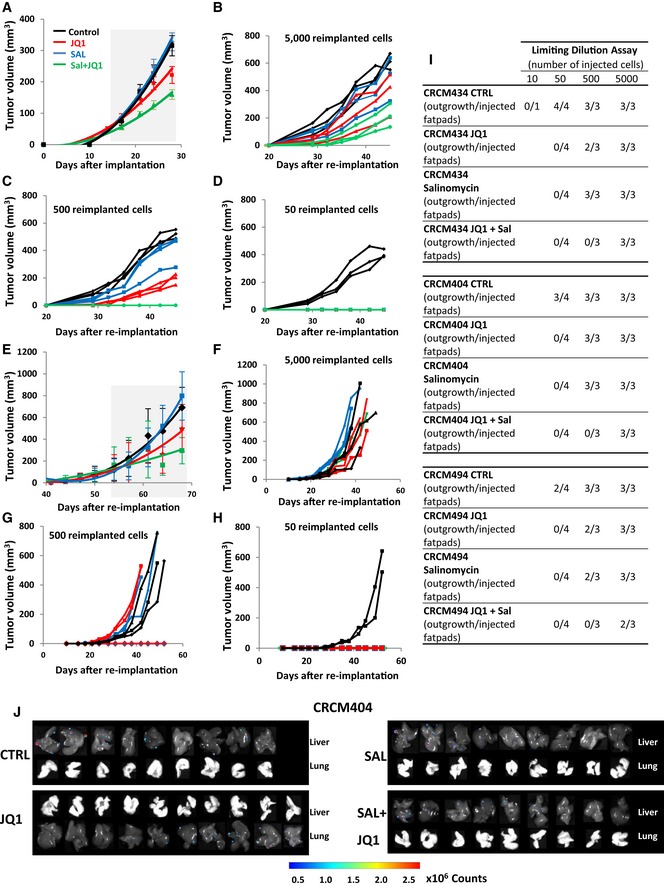
A
Effect of JQ1 and salinomycin treatment on the tumor growth of CRCM404 (n = 10). The gray area corresponds to the treatment period. Data represent mean ± SD.
-
B–D
Reimplantation assay. Two‐week treated PDXs were reimplanted, in serial dilutions, into new recipient mice, and tumor growth was monitored (CRCM404). Each curve represents the growth kinetic from one individual injection.
-
E
Effect of JQ1 and salinomycin treatment on the tumor growth of CRCM 494 (n = 10). The gray area corresponds to the treatment period. Data represent mean ± SD.
-
F–H
Reimplantation assay. Two‐week treated PDXs were reimplanted, in serial dilutions, into new recipient mice, and tumor growth was monitored (CRCM494). Each curve represents the growth kinetic from one individual injection.
-
I
Table showing the number of outgrowths generated in NSG mouse fat pads as a function of the amount of injected cells isolated from CRCM404, CRCM434, and CRCM494 PDXs following JQ1, salinomycin, JQ1/salinomycin combination, or placebo treatment.
-
J
Effect of JQ1 and salinomycin treatments on the metastasis formation of CRCM404. Metastasis formation was monitored using bioluminescence imaging in mice livers and lungs.

