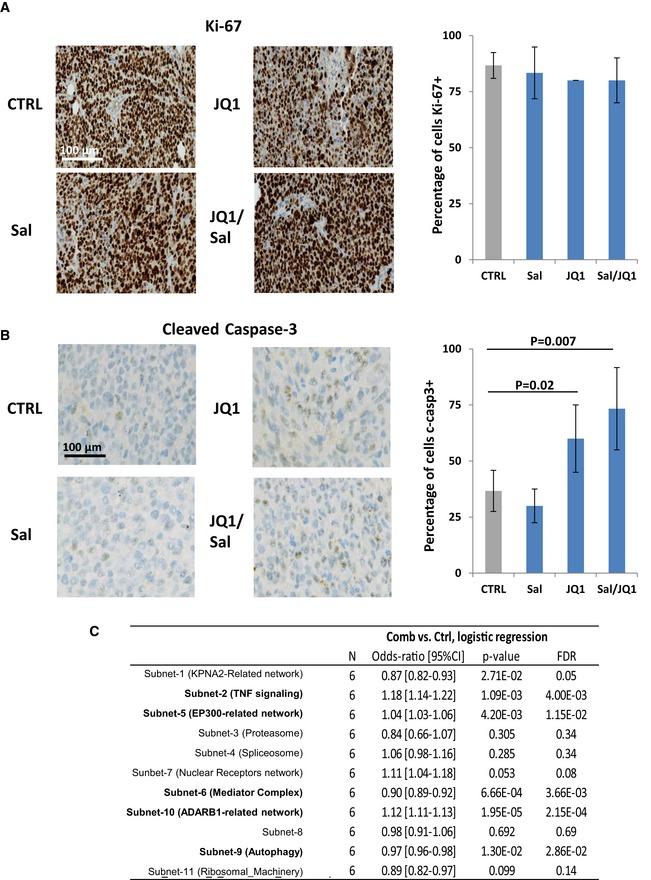
Figure EV5. Effect of salinomycin/JQ1 treatment on cell proliferation, apoptosis, and subnetwork gene expression in PDXs.

-
ARepresentative KI67 immunostaining (brown staining) in different treated tumors (right panel). Counterstaining is in blue. Quantification of the proportion of proliferative KI67+ cells (left panel). Statistical test used is t‐test. Data represent mean ± SD (n = 3).
-
BRepresentative cleaved caspase‐3 immunostaining (brown staining) in different treated tumors (right panel). Counterstaining is in blue. Quantification of the proportion of apoptotic, cleaved caspase‐3+ cells (left panel). Statistical test used is t‐test. Data represent mean ± SD (n = 3).
-
CTable showing the detailed results of the logistic regression analysis for each subnetwork.
