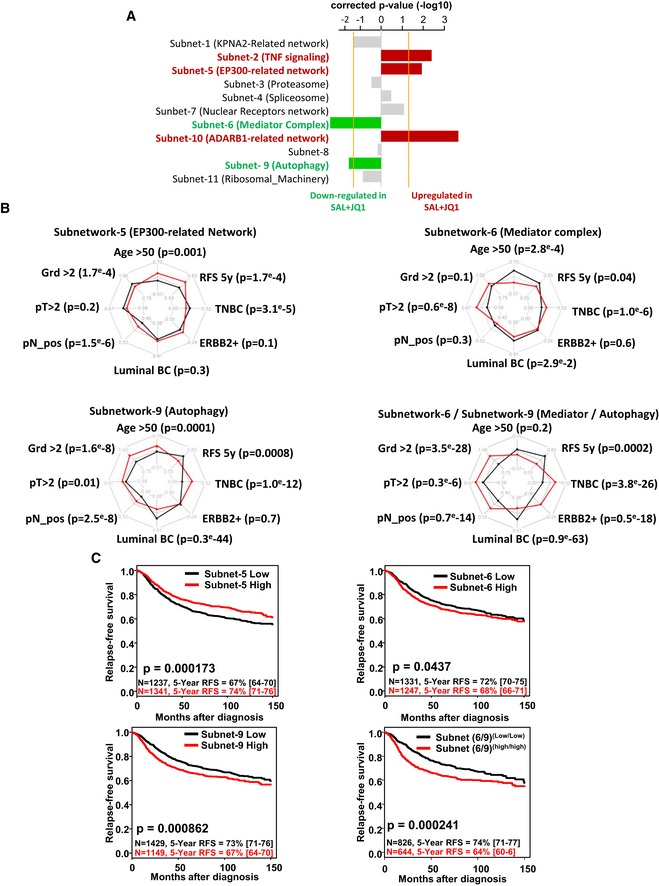
Figure 6. Clinical association between subnetwork metagene expression and breast cancer prognosis.

-
ABar plot representing the corrected P‐value of the logistic regression comparing the gene expression level of each subnetworks in salinomycin/JQ1‐treated tumors compared to the control. Subnetworks presenting a significant downregulation (green bars, P <−1.3) or upregulation (red bars; P > 1.3) of their metagenes in the salinomycin/JQ1‐treated tumors are highlighted.
-
BRadar charts comparing clinicopathological features for the patients classified according to the expression of the metagene from the subnetworks 5, 6, and 9 and the combination of subnetworks 6 and 9. Each axis of the diagrams represents a scale of proportions for a specific feature, ranging from 0 to 1. *, chi‐square test, P < 0.0001.
-
CKaplan–Meier relapse‐free survival curve according to subnetwork metagenes expression levels in breast tumors. Curves were compared with a log‐rank test (P‐value).
