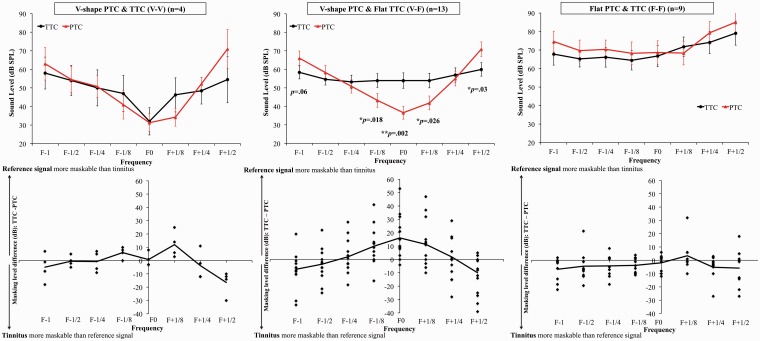
Figure 5.
The upper graphs represent the average PTCs (red triangles) and TTCs (black diamonds) for each masker frequency for each TTC and PTC group. The lower graphs represent individual differences between the TTC and PTC value for each masker frequency. A positive value suggests that the reference signal was more maskable than the tinnitus, and a negative value suggests that the tinnitus was more maskable than the reference signal.
PTC = psychophysical tuning curve; TTC = tinnitus tuning curve; SPL = sound pressure level.

