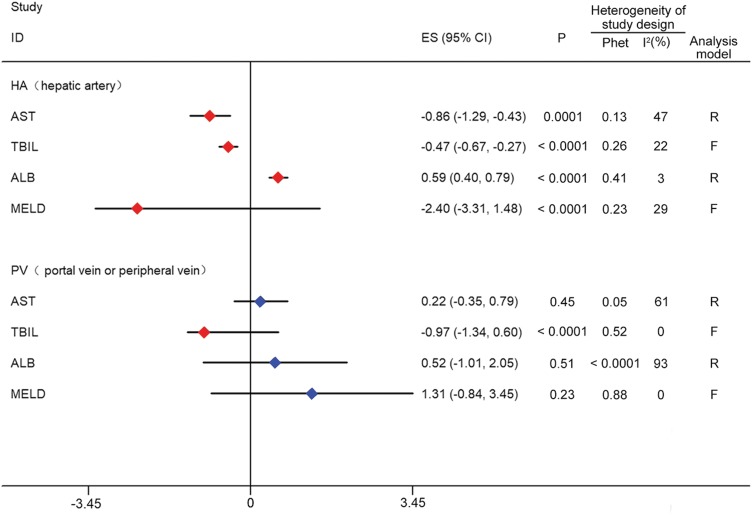
Fig. 3. Forest plot of the delivery route.
Red indicates significant improvement compared with the control group; blue indicates no significant improvement. AST, TBIL, ALB and MELD were significantly improved (P < 0.05) in group HA. Only TBIL was significantly improved (P < 0.05) in group PV.
Abbreviations: ALB, albumin; AST, aspartate aminotransferase; F, fixed effects model; HA, hepatic artery; MELD, model for end-stage liver disease; Phet, p value of heterogeneity; PV, portal vein or peripheral vein; R, random effects models; TBiL, total bilirubin.

