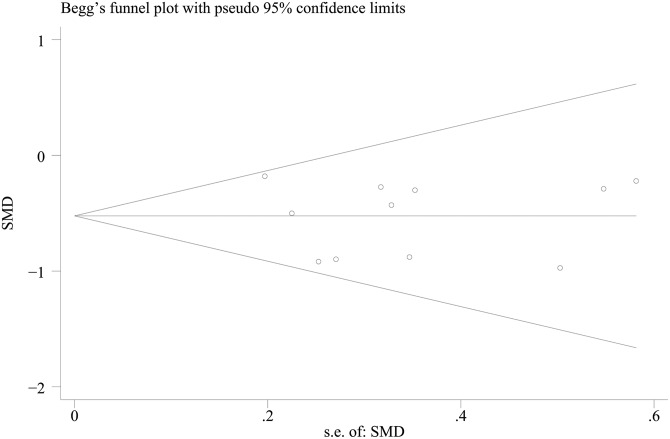
Fig. 5. A Begg’s plot of TBIL.
The horizontal line in the funnel plot indicates the fixed effects summary estimate, while the sloping lines indicate the expected 95% confidence intervals for a given standard error, assuming no heterogeneity between studies. No publication bias was observed among studies using Egger’s (p = 0.91) test, which suggested that there was no evidence of publication bias.
Abbreviation: TBIL, total bilirubin.

