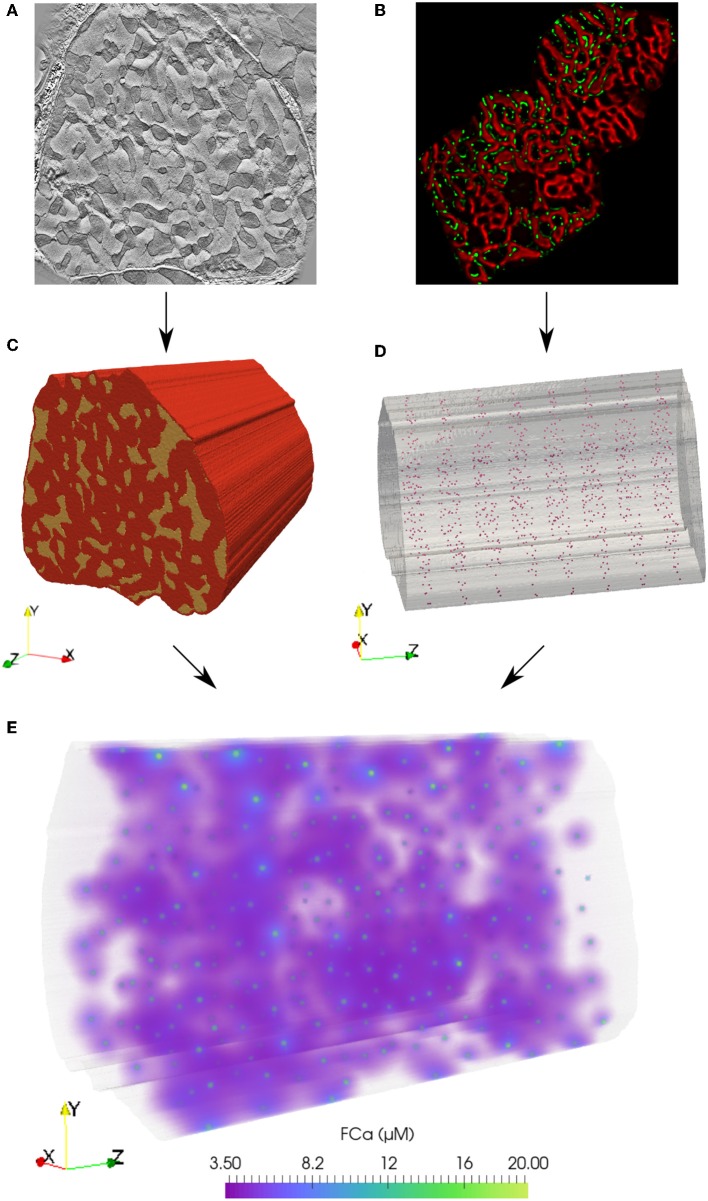
Figure 1.
Finite element model of Ca2+ reaction-diffusion in an eight sarcomere section of a cardiomyocyte. (A) From an electron tomography imaging stack, myofibril and mitochondria regions were segmented from a slice at the depth of a z-disk. (C) This geometry was extruded 16 μm (in the direction shown as z here) to create a three-dimensional eight-sarcomere model. Mitochondrial regions shown in yellow; red volume indicates the myofibrillar and cytosolic region. (B) Statistical analysis of immuno-labeled microscopy data (RyR clusters shown in green) was used to determine inter-cluster spacing distributions. (D) RyR cluster locations in the model were defined at mitochondrial and myofibrillar border regions based on statistical spacing distributions. (E) A reaction-diffusion finite element model simulates the release of Ca2+ from the RyR clusters during the rising phase (first 30 ms) of the Ca2+ transient. Volume rendering of the fluorescence-bound Ca2+ (FCa) field shown at t = 15 ms.

