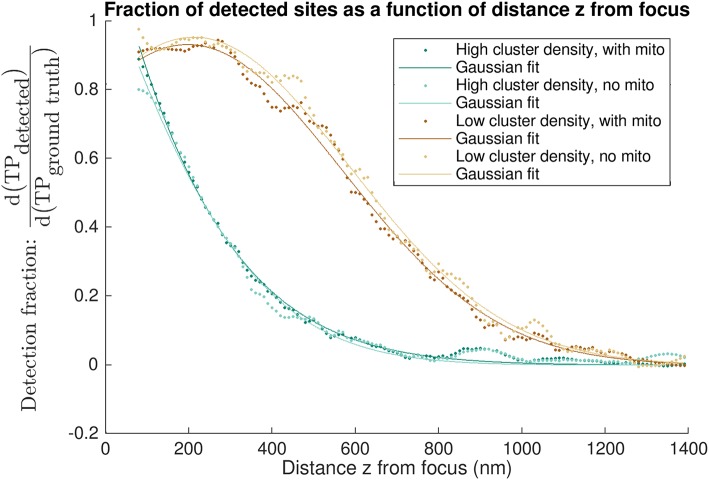
Figure 7.
“Differential recall”: axial dependence of detection of true positive sites. Each curve shows the fraction of detected sites as a function of the distance z from the nominal focal plane. Differential recall at distance z is the fraction of all detected to modeled sites within 5 nm of that z depth i.e., within a 10 nm band centered about the distance z above and below the focal plane. A value of 1 is equivalent to the detection of all sites at a given z-depth. The various curves are calculated for different models, having a high or low density of sites and either using homogeneous diffusion (“no mito”) or obstacles to diffusion wherever mitochondria are (“with mito”). Data points shown are the result of applying a smoothing filter (see Figure S5 for the low density, no mito case shown in light brown). Solid lines indicate single-term Gaussian fits to the filtered data.

