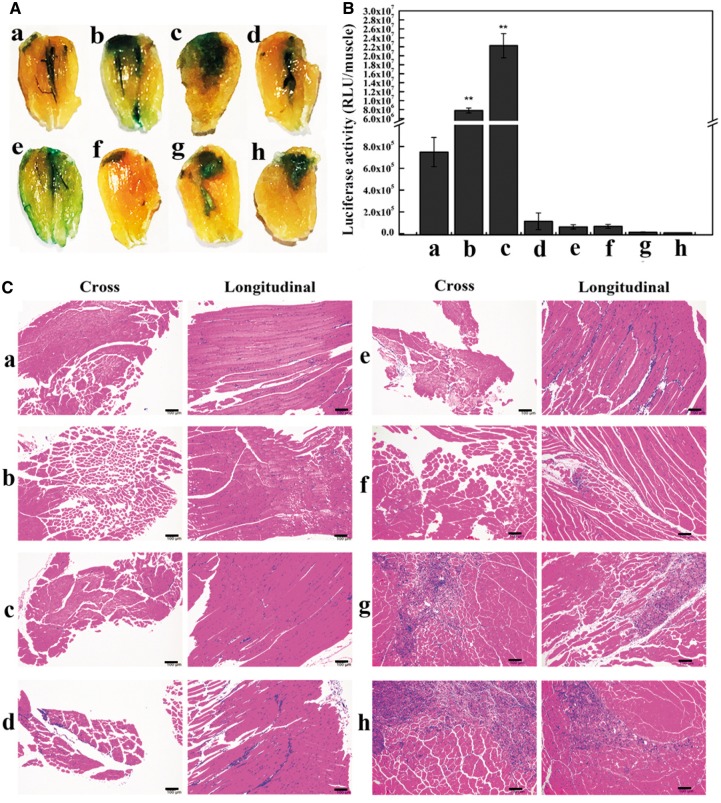
Figure 3.
In vivo evaluation of transgene expression in L/E/P system and the histological analysis of the injected TA muscles. n = 6. Time: 7 days after injection. (A) Qualitative observation of β-galactosidase expression. (B) Quantitative detection of luciferase activity. (C) Representative H/E-stained tissue sections of the injected TA muscles. (a) Naked pDNA group; (b) L/E group; (c–h) L/E/P groups with various N/P ratios ranging from 0.5, 1, 1.5, 3, 10 and 15, respectively. **P < 0.01 vs. pDNA. Scale bar = 100 µm

