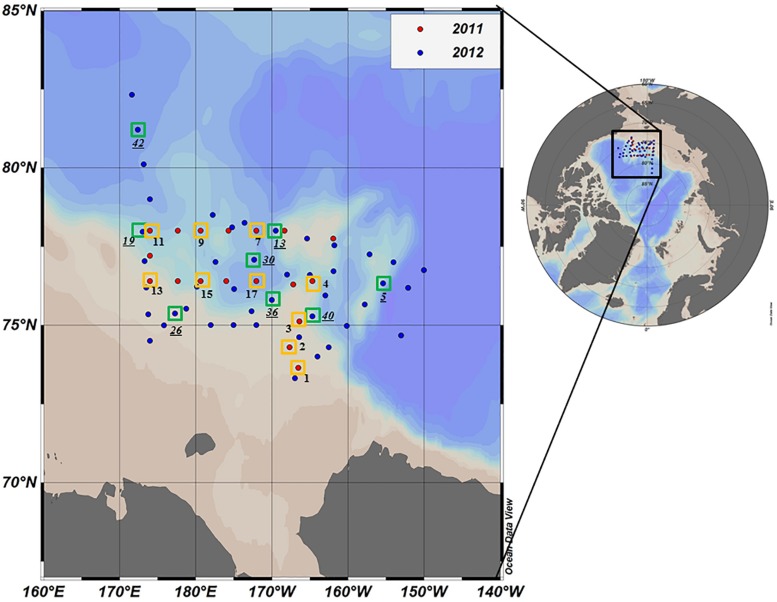
FIGURE 1.
Location of the sampling stations in the northern Chukchi Sea during summer 2011 and 2012. Red and blue dots represent the stations visited in 2011 and 2012, respectively. The photosynthetic end-products were measured at the stations identified by yellow (2011) and green (2012) squares. Station ID in 2012 is underlined.

