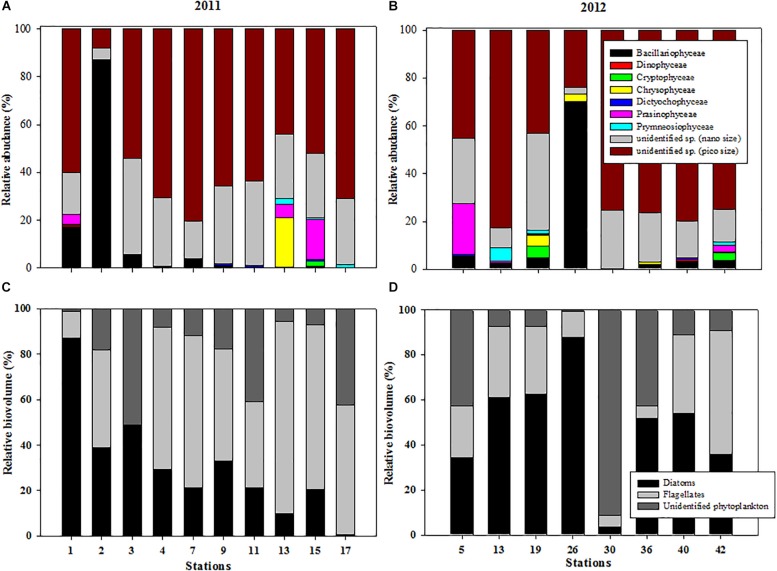
FIGURE 4.
Variations in the relative abundance of taxonomic groups at each station during (A) 2011 and (B) 2012 and relative biovolumes of three phytoplankton groups (diatoms, flagellates, and unidentified nano- and pico-sized phytoplankton) at each station in the northern Chukchi Sea during (C) 2011 and (D) 2012.

