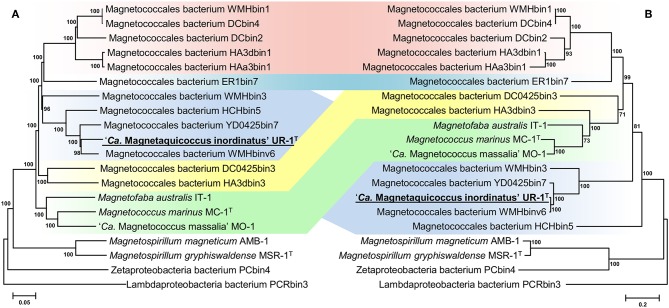
Figure 3.
Maximum-likelihood phylogenetic trees inferred from a comparison of (A) concatenated Magnetococcales 120 single copy marker proteins showing the position of the UR-1 and (B) concatenated magnetosome associated protein (MamABEHIKLMOPST) sequences. Both trees reconstructed with evolutionary model LG+F+I+G4. The scale bar represents amino acid substitutions per site.

