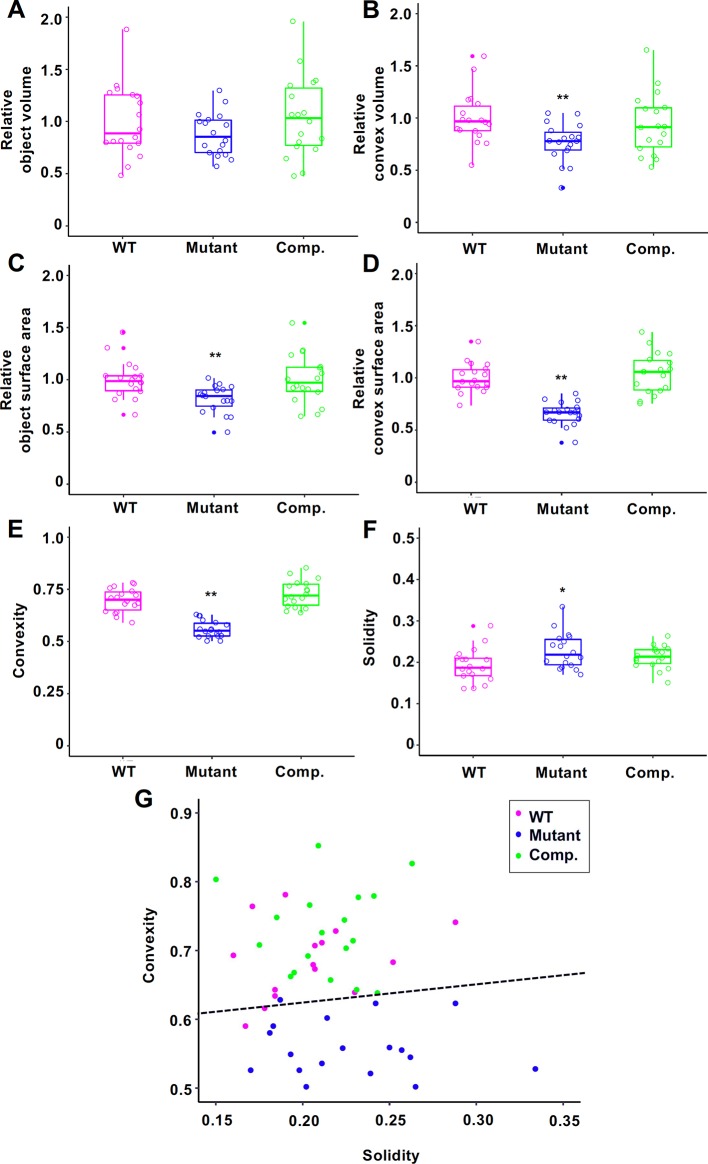
Figure 4.
Morphological descriptors of 12-day-old gemmalings of Tak-1 (wild type (WT)), Mpan-1ko (Mutant), and pMpAN:MpAN-1/Mpan-1ko (Comp.) Relative object volume (A), relative convex volume (B), relative object surface area (C), relative convex surface area (D), convexity (E), and solidity (F) are shown in box-and-whisker plots. Median values (middle bars) and first to third interquartile ranges (boxes); whiskers indicate the interquartile ranges of ∼1.5 Å; dots indicate outliers. The data in (A–D) are indicated as relative value to mean of Tak-1. Circles indicate value of each individual. Asterisks indicate significant differences compared with Tak-1 (*P < 0.05, **P < 0.01, Student’s t-test). N = 18. (G) Scatter plot of solidity versus convexity. Dashed black line is the classification boundary obtained by linear discriminant analysis using Tak-1 and Mpan-1ko.

