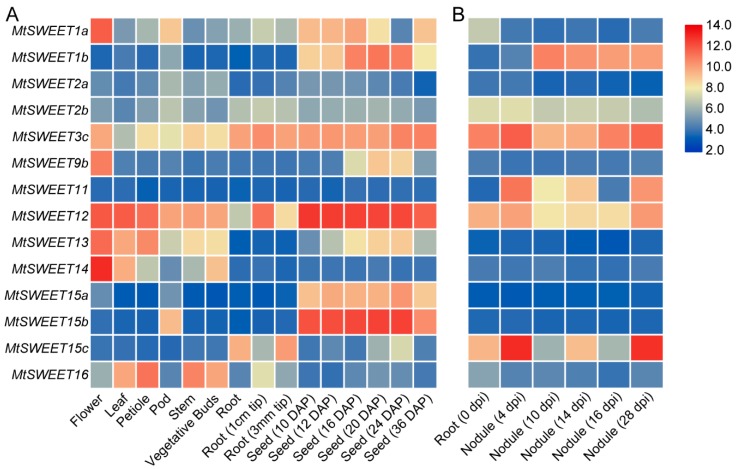
Figure 5.
Expression analysis of the MtSWEET genes in different developmental tissues (A) and during nodule development (B) of M. truncatula using microarray data. The expression levels of the MtSWEET genes are shown as the log2-based fluorescence intensity values from the microarray data (MtGEA, https://mtgea.noble.org/v3/). DAP, days after pollination. dpi, days post inoculation.

